
Approach
We use a thoughtful, time-tested investment philosophy to help you build wealth. We cut out the noise and focus on building your long-term savings. It’s not thrilling, but it works.
We seek to deliver long-term market returns with significantly less volatility through market ups and downs. Our investment team includes renowned experts like David Gibson Moore (ex-chairman of JP Morgan Chase Switzerland) and Professor Jiro Kondo (Ph.D. from MIT and ex-Goldman Sachs) who bring the world’s top investing strategies to use when constructing your portfolio.
We deliver an automated investment service that maximises the net long-term investment return for each client’s particular tolerance for risk. Optimal portfolios are identified using Modern Portfolio Theory (MPT) and combine a broad set of asset classes, each usually represented by a low-cost, passive exchange-traded fund (ETF).
We launched in 2018 with an investing strategy based on more than 50 years of advanced research in MPT. The result was a portfolio strategy composed of ETFs with customisable risk management. Over time, we’ve improved our Sarwa Portfolio Strategy and developed more personalised and expertly-built portfolios for each customer. Each advancement emerged from identifying more efficient, effective, and robust methods.
We continuously monitor and periodically rebalance portfolios to ensure they remain optimally diversified. We also help minimise your taxes by analyzing the taxes (e.g. Estate Taxes) likely to be generated by creating allocations that are specifically customised.
Principles of Success
Start early, with discipline
Albert Einstein called compound interest “the 8th wonder of the world.” Listen to the smartest man who ever lived – invest early and often.
Keep costs low
Fees compound over time and eat into your returns. We choose low-cost ETFs and charge a ridiculously small monthly management fee on what you invest — less than half of the industry average. The average investor in Middle-East is paying more than 2% per year in fees – more than any other developed country in the world – and up to 5% in fees when investing with a bank or insurance firm.
Diversify
Harry Markowitz won a Nobel Prize for discovering that diversification reduces risk without hurting returns. Some investments go up, others go down. Overall, the balance makes you better off.
Passive Investment Approach
The vast majority of professional stock pickers fail to beat the market. Simply tracking the market instead can yield better results in the long term. In fact, the review of active funds published by S&P Dow Jones Indices published in the last few years (SPIVA US Scorecard), indicates that between 80%-99% of active funds have underperformed their benchmarks over the last 15 years.
Our methodology employs 5 steps:
- Identify a diverse set of asset classes.
- Select the most appropriate ETFs to represent each asset class.
- Apply Modern Portfolio Theory (MPT) to construct asset allocations that maximise the expected return for each level of portfolio risk.
- Customise your risk tolerance to select the allocation that is most appropriate for you.
- Monitor and periodically rebalance your portfolio taking advantage of dividend reinvestment.
Identify a diverse set of asset classes
Approach
Research has consistently found that the best way to maximise returns across every level of risk is to combine asset classes rather than individual securities. MPT is the most widely accepted framework for managing diversified portfolios. The economists who developed MPT, Harry Markowitz, and William Sharpe, received the Nobel Prize in Economics in 1990 for their groundbreaking research.
Therefore the first step in our methodology is to identify a broad set of diversified publicly available asset classes. We consider each asset class’s long-term historical behavior, risk-return relationship, and expected behavior based on long-term trends and the macroeconomic environment. We also evaluate each asset class’s volatility, correlation with the other asset classes, liquidity, and tax efficiency.
Each asset class plays one of three roles: growth, income protection or inflation assets. In simple terms, stocks drive growth, bonds provide a cushion during economic turbulence due to their low volatility and low correlation with stocks, and real-estate protects investors from inflation in both moderate and high inflation environments. Putting these different asset classes together in the right proportions both improves performance and reduces risk (in investment-speak, this practice is known as diversification).
Watch our 2-min explainer on diversification below:
Based on our analysis, we currently consider the following asset classes:
U.S. Stocks
represent an ownership share in U.S.-based corporations. The U.S. has the largest economy in the world. Even though significant historical drawdowns, such as the crisis of 2008, demonstrate the possible risk of investing in equities, the U.S. economy is still one of the most resilient and active in the world.
Foreign Developed Market Stocks
represent an ownership share in companies headquartered in developed economies like Europe, Australia and Japan. Foreign Developed Markets represent a significant part of the world economy.
Emerging Market Equities
represents an ownership share in foreign companies in developing economies such as Brazil, China, India, South Africa, and Taiwan. Compared with developed countries, developing countries have younger demographics, expanding middle classes and faster economic growth. We expect them to deliver higher returns than U.S. Stocks and Foreign Developed Markets Stocks for the
long term.
Government Bonds
are debt issued by the U.S./Developed Markets federal government and agencies to fund various spending programs. U.S. Government Bonds provide steady income, low historical volatility and low correlation with stocks.
Corporate Bonds
are debt issued by U.S./Developed Markets corporations with investment-grade credit ratings to fund business activities. They offer higher yields than U.S. Government Bonds due to higher credit risk, illiquidity, and callability (a feature of a security that allows the issuer to redeem the security prior to maturity by calling it in, or forcing the holder to sell it back).
Emerging Market Bonds
are debt issued by governments and quasi-government organizations from emerging market countries. They offer higher yields than developed market bonds.
Real Estate
is accessed through publicly traded U.S. real estate investment trusts (REITs) that own commercial properties, apartment complexes and retail space.
Select the most appropriate ETFs to represent each asset class
Why do we recommend investing in ETFs?
An ETF is a security that generally tracks a broad-market stock or bond index or a basket of assets just like an index mutual fund, but trades just like a stock on a listed exchange. By design, index ETFs closely track their benchmarks—such as the S&P 500 or the Dow Jones Industrial Average—and are bought and sold like stocks throughout the day.
Sarwa uses low cost, index-based Exchange Traded Funds (ETFs) to represent each asset class. In contrast, many financial advisors have historically recommended actively managed mutual funds. A significant amount of research has been published that shows active mutual funds not only underperform the market, but those that outperform in one period are unlikely to outperform in subsequent periods (i.e. their returns are
due to luck).
Asset class selection
We start from a large database of ETFs and only consider ETFs from most reputable ETF managers (e.g. Vanguard, BlackRock). We pick ETFs in each class that have the best mix of:
Low fees: All things being equal we attempt to choose the ETFs with the lowest expense ratios. As an example, two funds may have a similar return profile, but one fund company charges more. Compare the
Rydex S&P 500 Index Fund at 0.75% fees, with the Vanguard Index 500 ETF at 0.04% fees. These funds contain the exact same investment holdings, at very different prices.
High liquidity (transaction volume): We choose ETFs that are expected to have sufficient liquidity to allow purchases and sales at any time. Newly issued ETFs usually take a while before they are appropriate for a recommendation, even if they offer lower fees because the lack of liquidity may cause trading costs that more than offset their lower fees.
Performance – see next section
Sarwa Invest clients are not subject to estate taxes. This is made possible through our ADGM Category 3C Asset Manager license, which enables us to purchase assets on behalf of our clients while designating them as the beneficial owners. As corporations are exempt from estate tax, this structure ensures that in the unfortunate event of a client’s passing, their assets remain protected from estate taxation.
Halal/Socially Responsible: We use the same passive investment strategy as Sarwa’s other portfolios, but filter for ETFs which offer a low-cost, diversified way for people to invest while knowing their money is being invested in either Halal funds or socially conscious initiatives from around the world. For example, the halal portfolio consists of a globally diversified portfolio of BlackRock index funds that exclude companies profiting from industries that contradict Islamic values such as alcohol, gambling, tobacco, pork,
interest and others.
ETFs have seen significant growth
Source: Investment Company Institute 2016 Investment Company Fact Book, Chapter 3: Exchange-Traded Funds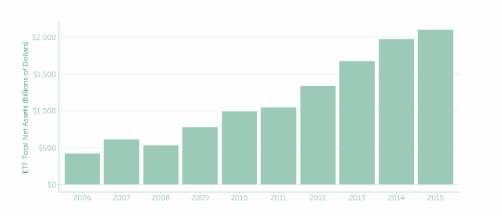
Average Expense Ratios
The chart below compares the asset-weighted expense ratios of the Sarwa Portfolio Strategy versus the average ETF, based on data collected by the Investment Company Institute in their 2018 Factbook. The range for average expense ratios of Sarwa’s recommended portfolios is 0.07% to 0.16%.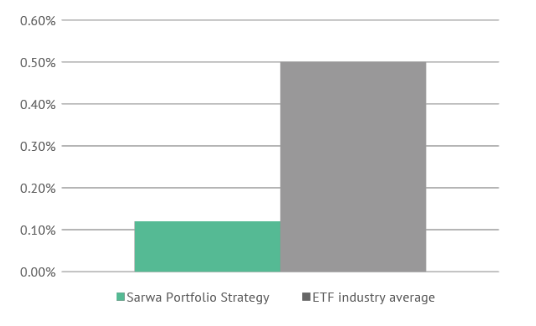
Construct asset allocations for each level of portfolio risk
Expected returns optimisation
Following our selection of ETFs, we need to estimate the risk-return properties of these ETFs in order to implement a Mean-Variance Portfolio Theory (MPT) analysis. Specifically, we need estimates of forward-looking expected returns and the variance-covariance matrix of returns for this set of ETFs.
Expected returns are estimated using an approach similar to the Black-Litterman model. In particular, our estimates of expected returns are obtained from a blended average of three sets of simpler expected
return measures: (1) a long-term historical average for a given asset class’ returns (e.g., for the index that an ETF is meant to track – adjusted for fees), (2) an estimate from a mix of modern empirical asset pricing models (e.g., like the CAPM, the Fama-French 3-factor model, and Zhang’s q5 model), and (3) estimates from a reverse-optimized MPT analysis that ensures portfolio weights do not deviate wildly from the value-weighted market portfolio. We estimate the risk of those investments by looking at their 10-year window of historical ETF monthly returns. If a particular ETF does not have a 10-year window, we look at the entire window available. However, we do not use the historical monthly returns to estimate future returns. This is because estimates are known to be inaccurate and such inaccuracies may have huge impacts on the portfolio.
To account for these problems, we assume expected returns are in line with a mix of two considerations:
Longer-term historical averages (30 years)
Fair “risk-reward” going forward – as measured by modern asset pricing models (e.g., CAPM and Fama-French 3-factor model).
Covariance
Meanwhile, our estimate of the variance-covariance matrix is obtained from historical data. In order to account for time-variation in this matrix, our estimate takes into account sample variances and covariances over different horizons and, to improve precision, uses higher frequency data (while being careful to avoid mismeasurement due to liquidity issues). This estimate of the variance-covariance matrix will be periodically updated on an annual basis. For the US ETF portfolio, our current estimate of standard deviations of returns (square root of variance) is roughly 3 percent for the bond ETFs and ranges from 10 to 15 percent across the real estate and equity ETFs. Our current correlations among these portfolio components are provided in the table below.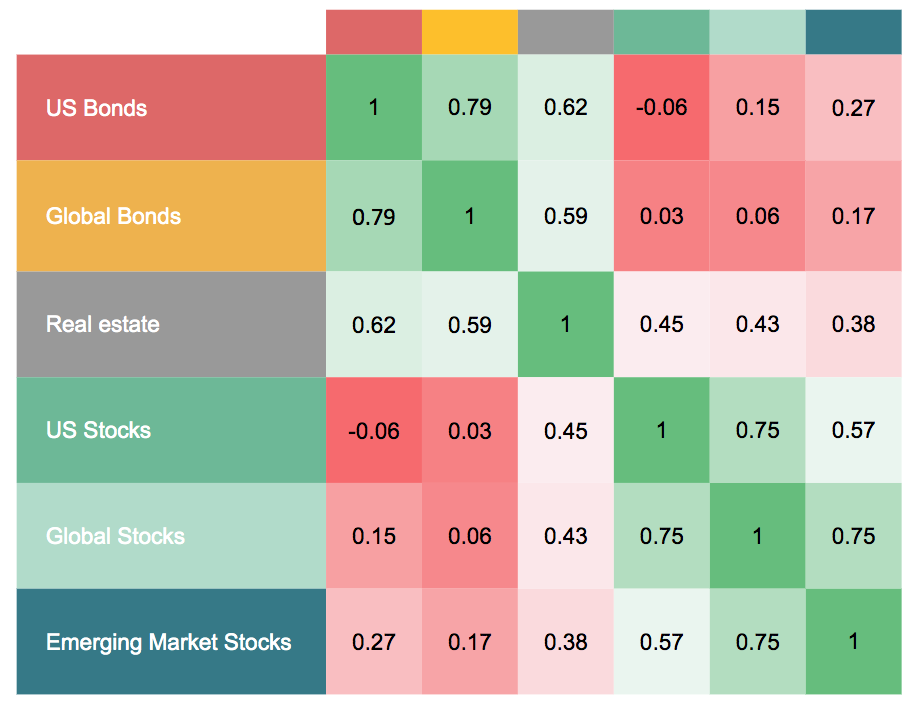
Using these estimates, we obtain mean-variance efficient portfolios for different target portfolio expected returns “a la Markowitz”. However, we also account for the possibility of estimation error in our estimate of the joint distribution of returns. We do this by implementing a more robust optimization than the traditional MPT analysis. Specifically, we pick portfolios whose performance (as measured by a certainty equivalent) doesn’t erode too much across reasonable differences between our estimated and the true expected returns. Roughly, this is achieved using a combination of ETF-specific portfolio weight caps (linked to the ETF’s own variance of returns) and a Monte Carlo analysis.
Our resulting ETF portfolios are tailored to an investor’s degree of risk tolerance. For instance, an investor who is classified as having “average” risk tolerance would hold 26% of their portfolio in bonds (13% in BND and BNDX), 69% in equities (35% in VTI, 26% in IEFA, and 8% in IEMG), and 5% in real estate (VNQ). Our approach to measuring an investor’s risk tolerance is described in the next section. In the figure below, we display the performance of the “average” risk tolerance portfolio compared to an index that tracks the performance of portfolios recommended by a large sample of US-based financial advisors.
10 year historical from May 2009 (Sarwa balanced portfolio): 2.59x (Sarwa) vs 1.84x (PCI)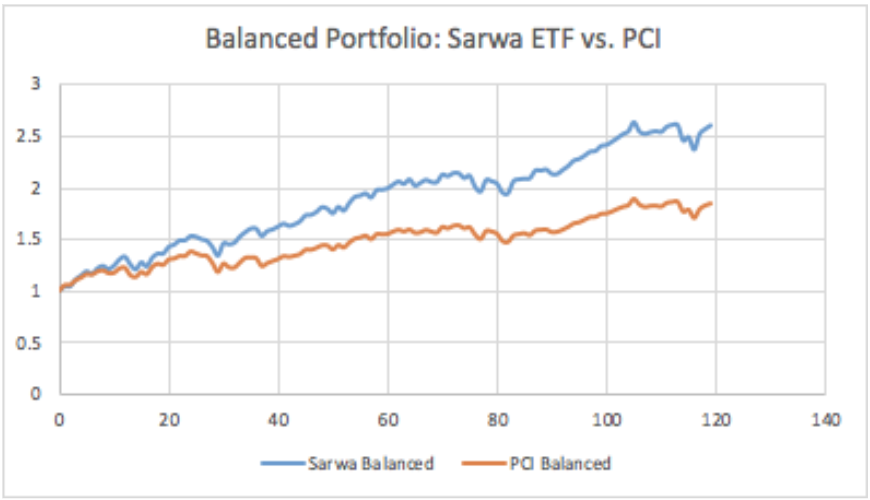
Target allocations for various risk levels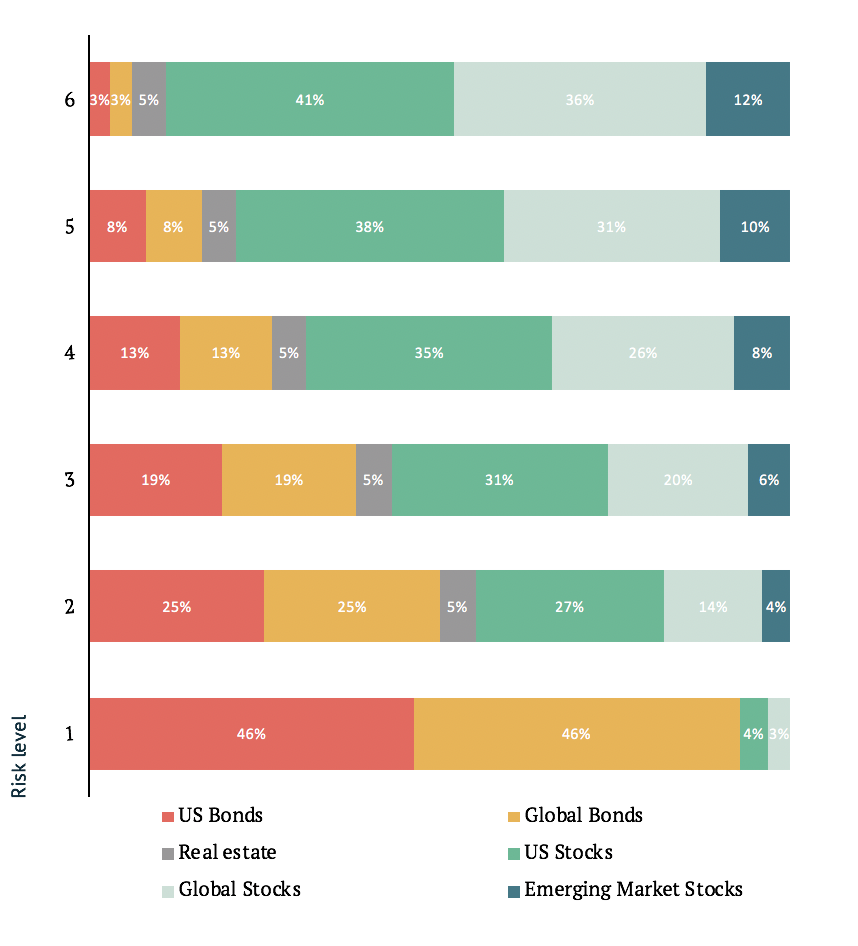
Customise your risk tolerance to the allocation that is most appropriate
Risk questionnaire
We build a personalised portfolio for you that considers your unique needs and goals. In particular, we focus on accommodating your personal tolerance for risk. Accurately assessing your risk tolerance is important. If you overestimate it, investing will feel like a bumpy ride and it will be tough to stick to your plan during big market swings. If you get your risk tolerance right, you will be well on your way to long-term investing success. Rather than asking the typical 30+ questions asked by financial advisors to identify an individual’s risk tolerance, Sarwa combined behavioral economics research to simplify our risk identification process to only a few questions. Through a risk questionnaire, we will help you understand your tolerance for risk and build you a portfolio that aligns with your needs.
Our overall Risk Score combines subjective and objective risk tolerance with a heavier weighting to whichever component is more risk-averse. We chose this approach because behavioral economics research shows individuals consistently overstate their true risk tolerance. There are 3 input components to the algorithm:
Knowledge & Experience: How experienced is the client in understanding and tolerating risk?
Behavioral Risk Tolerance Factors: How risk-averse is the client, inherently (sentimental) and through other factors?
Economic Risk Tolerance: How much risk do the client’s economic situation and aspirations allow?
We email our clients periodically to determine if anything in their financial profile has changed that may affect their risk tolerance. We allow clients to adjust their assigned risk score, in the event they want a more or less conservative allocation based on their individual circumstances.
Monitor and periodically rebalance your portfolio
Rebalancing
Some investments go up, while others go down. Over time, your portfolio will drift from your target mix of investments. If an asset class drifts more than 12% from your target position, we will reset your asset mix to keep your portfolio balanced. By selling some of your investments that are up and buying some that are down, you smooth the impact of market movements. This systematic approach to investing keeps you on track in the best of times and the worst of times. This is investing on autopilot. To learn more about investing, please visit www.sarwa.co/blog for videos and educational blogs.
Ready to invest in your future?