
How did you feel the last time you bought something for a price less than its true value? Elated, right? What about the last time you bought something for a price that is higher than its true value? Sad, right?
For investors, buying stocks at a price less than their intrinsic value is a way to maximize the return on investment. But how do you know the intrinsic value of a stock? The P/E ratio is one of the most popular valuation methods that investors use to determine the intrinsic value of a stock.
But what is the P/E ratio in the stock market and how can you use it for stock valuation? This article will answer these questions and others by covering:
- What is the P/E ratio in the stock market? A basic introduction
- How to use the P/E ratio as a multiples valuation method
- What is the meaning of the P/E ratio in the stock market: Avoiding interpretation pitfalls
Do you want to learn more about how to invest in the stock market? Subscribe now to Sarwa’s Fully Invested Newsletter for weekly investing insights.
1. What is the P/E ratio in the stock market? A basic introduction
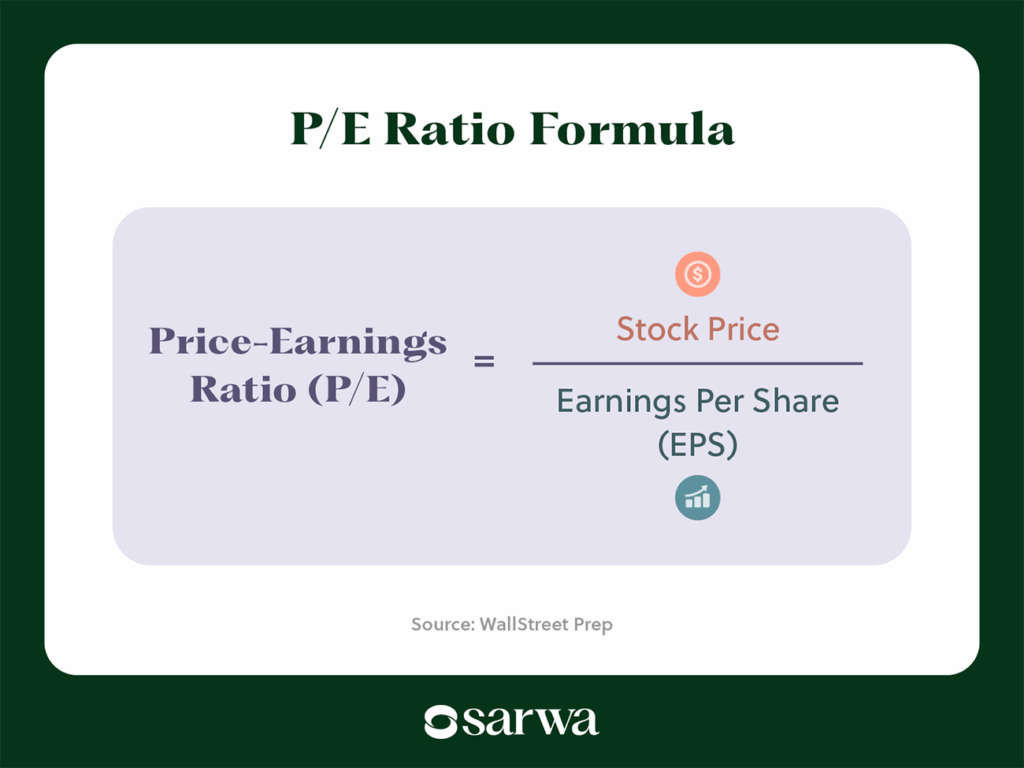
The price/earnings ratio is the ratio of a company’s share price to its earnings per share (EPS). It can be mathematically expressed as market price / EPS. It is also known as the earnings multiple or the price multiple.
How to interpret the P/E ratio
Before going into the mundane part of how to calculate the P/E ratio, let’s consider the more interesting part: what is the meaning of the P/E ratio in the stock market?
The P/E ratio is the stock’s market value relative to its earnings and it tells you how much investors are willing to pay to get a unit of a company’s earnings. If we are dealing with a US company, then the P/E ratio tells us how much investors are willing to pay to get $1 worth of the company’s earnings.
For example, AAPL’s P/E ratio is 28.80 at the time of writing. This means that AAPL investors are at this time willing to pay $28.80 just to get $1 worth of AAPL’s earnings. In contrast, NVDA’s P/E ratio is currently $33.21, which means investors are willing to pay $33.21 for access to $1 of NVDA’s earnings.
(Disclaimer: Using a stock as an example does not constitute a recommendation.)
Many people will then conclude that this means that AAPL is cheaper than NVDA since it costs less to get $1 of AAPL than it is to get $1 of NVDA. This is an outgrowth of the idea that a low price-to-earnings ratio means a stock is undervalued while a high price-to-earnings ratio means it is overvalued.
However, this is too crude a way to interpret this ratio. This is because investors are often willing to pay more for a unit of a company’s earnings if they believe that the company has more growth potential going forward. Thus, they may be willing to pay higher for NVDA because of their estimate of its future earnings growth.
Thus, the only time we can confidently conclude that company A is cheaper than B based on the P/E ratio is if they also have the same growth estimate. For example, if we assume that AAPL and NVDA will grow their earnings at an annual average of 20% over the past five years, then we can more confidently say that AAPL is cheaper than NVDA.
But more on this later.
How to calculate the P/E ratio
We said that the P/E ratio is the current price of a company divided by its EPS. The market price is self-explanatory – it is the current share price or the price at which the company’s stock is currently trading on the stock exchange market. But what is the EPS?
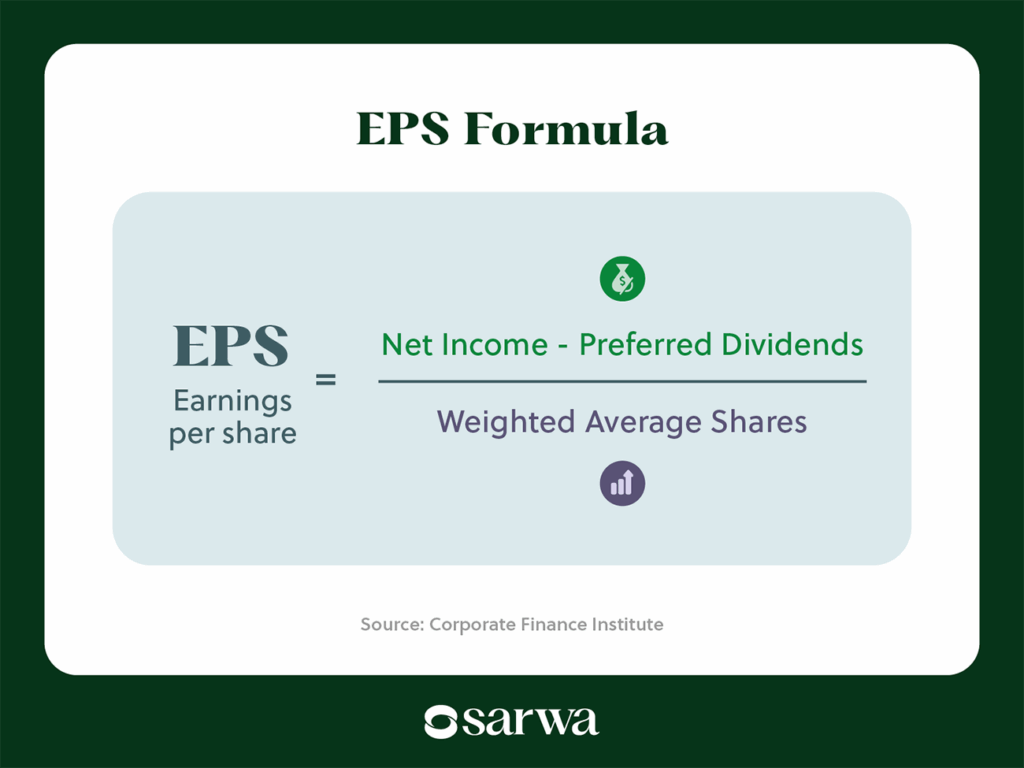
EPS is the net income of a company for a given period (a quarter or a year) divided by the number of its outstanding shares (number of shares held by all shareholders).
If the company has preferred shareholders, then the EPS is calculated as net income minus preferred dividends divided by the number of outstanding shares. Preferred dividends are deducted since the goal of the EPS is to show earnings available to common shareholders only.
The EPS can be in its basic or diluted form. The basic EPS only considers current common shares when calculating outstanding shares while diluted EPS also considers securities like employee stock options and convertible bonds that can be converted into common shares in the future. The latter is often preferred by investors since it is a more conservative approach that takes into view possible future dilution.
Let’s take an example to illustrate the calculation. Apple released its Q4 2024 financial statements on October 31, 2024. Its net income was $14.736 billion for the quarter (no preferred dividends), basic shares were 15,171,990,000, and diluted shares were 15,242,853,000. Based on these figures, the basic and diluted EPS were calculated as $0.97 for the quarter (two-decimal approximation).
Thankfully, you don’t need to calculate the P/E ratio of a company yourself. Most stock trading and stock analytics platforms report these figures as part of stock statistics.
2. How to use the P/E ratio as a multiples valuation method
The multiples valuation method is an approach that values a company based on how comparable companies (also called peers) are priced, using multiples or financial metrics like the P/E ratio, the price-to-sales ratio (P/S ratio), price-to-book value ratio, among other metrics.
It’s a similar approach to the sales comparison approach used for real estate valuation. There, it is assumed that if certain properties are similar in regards to location, amenities, size, quality of building materials, etc, then their value should be equal or at least quite close.
In stock valuation, the idea is that if certain companies operate in the same industry, have similar business models, comparable revenue and assets, and similar growth rates, then they should have the same or at least comparable fair value.
Thus, one way to use the P/E ratio is to make it the basis for a multiples valuation method.
How does this work? Below are the steps involved:
- Find companies that are comparable to the company being valued (the target company)
- Calculate the P/E ratio (or any other multiple) for the comparable companies
- Find the average of the P/E ratios calculated for these companies
- Calculate the EPS for the target company
- Multiply the EPS with the average P/E ratio of comparable companies to get the fair price of the company being
In most cases, investors will repeat this process using other valuation multiples and then find the average fair price across all the methods used.
This is an appropriate place to identify the two common types of P/E ratio used by investors: the trailing twelve months (TTM) P/E ratio and the forward P/E ratio (FWD P/E ratio). The former is calculated based on the company’s EPS over the past 12 months while the latter is calculated based on its projected earnings for the next 12 months.
We can thus interpret the former as how much investors are willing to pay to get a unit of a company’s current earnings and the latter as how much they are willing to pay to get a unit of its future annual earnings.
Let’s start with an example using the TTM P/E ratio.
Let’s say for example our target company is NVDA, the stock ticker of NVIDIA, a US technology company and a leader in the graphics processing units (GPUs) market.
Five companies qualify as peers (comparables) to NVDA, according to Seeking Alpha, a stock analytics platform:
- Taiwan Semiconductor Manufacturing Company Limited (TSM)
- Broadcom Inc. (AVGO)
- QUALCOMM Incorporated (QCOM)
- Advanced Micro Devices, Inc. (AMD)
- Texas Instruments Incorporated (TXN)
The trailing P/E ratio (current market price / EPS over the past 12 months) are as follows, according to Yahoo Finance, a stock analytics platform:
The next step is to calculate the average P/E ratio of these peers; that gives us 43.98. Given that NVDA’s EPS (TTM) is 2.94, then its fair price is $129.30. Since the company’s stock price is $97.64 at the time of writing, it can be considered undervalued.
However, as we said above, most investors using multiple valuation methods will go through the above steps using different multiples to arrive at a more accurate valuation.
Now, let’s shift our attention to the FWD P/E ratio – the current price divided by what the EPS is projected to be over the next twelve months. The FWD P/E ratio of NVDA’s comparables are as follows, according to projections by Seeking Alpha:
The average FWD P/E ratio of these peers is 19.21. Seeking Alpha also projects a FWD EPS of $4.52 for NVDA, which gives us a fair price of $86.84 per share. Based on the current stock price, it seems then that NVDA is overvalued.
3. What is the meaning of the P/E ratio in the stock market: Avoiding interpretation pitfalls
As we said above, you need to avoid simplistic interpretation of the P/E ratio such as the one that assumes that a lower P/E ratio relative to another company means that a stock is undervalued.
Below we consider some factors that you must bear in mind when seeking to interpret the P/E ratio:
Factoring in growth potential with the PEG ratio
Again, a high P/E ratio can imply that investors expect higher earnings growth from a company compared to its peers or other companies. So, how do you know if high P/E ratio means high growth potential or just plain overvaluation?
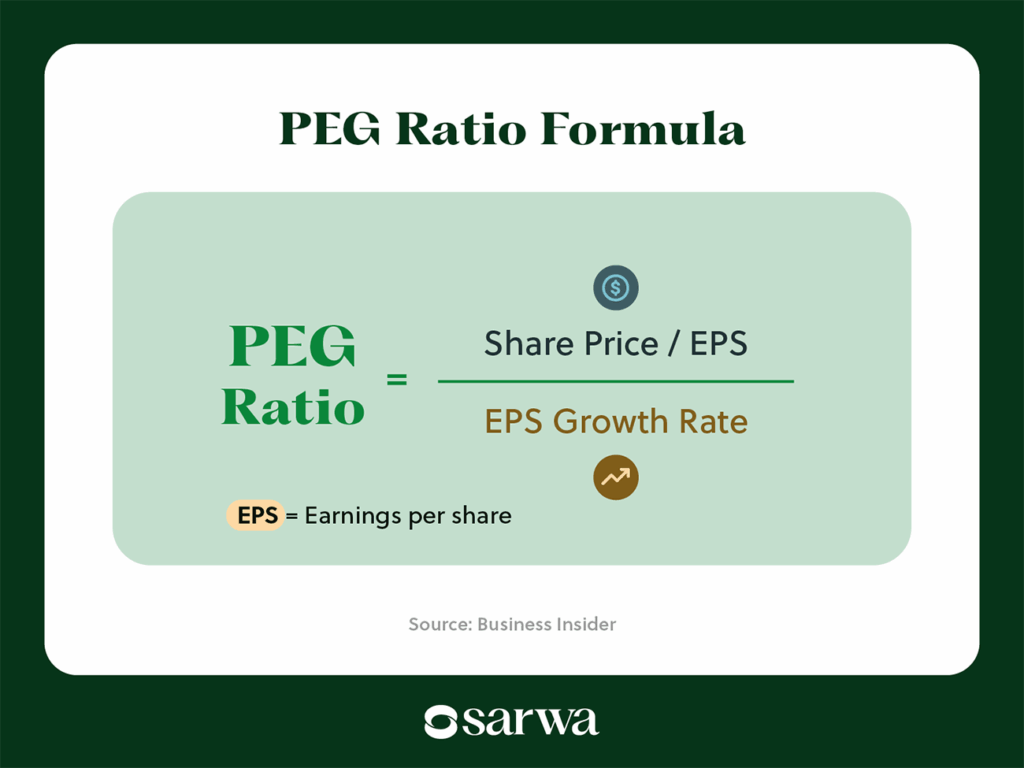
One useful approach is the price/earnings-to-growth ratio (PEG ratio). This is the P/E ratio divided by the expected earnings growth rate (usually the 5-year expected EPS growth). If the PEG ratio is less than 1, then the company is undervalued; if it is equal to 1, the company is appropriately valued; and if it is greater than 1, then the company is overvalued.
Let’s use AAPL as an example. Yahoo Finance projects a 17.14% 5-year expected EPS growth for AAPL, which results in a PEG ratio of 1.68. It thus appears that AAPL is overvalued. Since the 5-year expected EPS growth rate will vary across various stock analysts, the PEG ratio will also change from one stock analytics platform to another.
The PEG ratio is also a better way to compare two companies.
Let’s continue with the comparison between AAPL and NVDA. Yahoo Finance currently projects a 34.96% growth rate for NVDA which results in a PEG ratio of 0.95. This implies that NVDA is undervalued.
A more interesting point is that while NVDA has a higher PE ratio and looks more expensive than AAPL, it is actually the cheaper option when we factor in growth.
Limit the usage of P/E ratio to intra-industry comparisons
The P/E ratio on its own does not tell us much until we compare the figure for one company with other companies, an industry average, or an index or overall market average. This is why attempts to identify a general ideal or good PE ratio are misguided.
For example, knowing that Jio Financial Services (JIOFIN), an Indian company, is trading at a P/E ratio of 110.5 does not tell us much until we compare it with the P/E of another Indian company, the P/E of the industry, or the nifty price earning ratio.
The important point to be made here is that P/E ratios are better for intra-industry comparisons. Since capital structures, profitability levels, and growth expectations differ across industries, it is useless comparing the P/E ratio of two companies operating in different industries.
For example, utility companies tend to have lower P/E ratios due to the stability of both their price and earnings while tech companies usually have high P/E ratios due to the expectations of future growth.
Thus, when considering if a company is undervalued or overvalued, it is better to compare it with another company in the industry, its peers, or the entire industry. As we saw above, NVDA’s P/E ratio of 33.21 made sense when compared to its peers (with an average of 43.98). Also, it makes sense when compared to the IT sector of the S&P 500 Index, which has a P/E ratio of 32.82, according to World P/E Ratio, a website providing P/E ratio for companies across the globe.
On the other hand, it would have looked expensive if you compared it with Southern Company (SO), an utilities company with a P/E ratio of 20.40. Similarly, SO would have looked cheap in comparison with NVDA but its P/E ratio is slightly above its industry average of 20.20, according to Stock Analysis, a stock analytics platform.
Considering historical trends
While a stock can be undervalued or overvalued in comparison to other companies or its industry, the same evaluation can be made based on historical trends. That is, a stock can be overvalued or undervalued at a specific point in time when compared to its historical average.
Below is the trend of NVDA’s P/E ratio over the past 15 years.
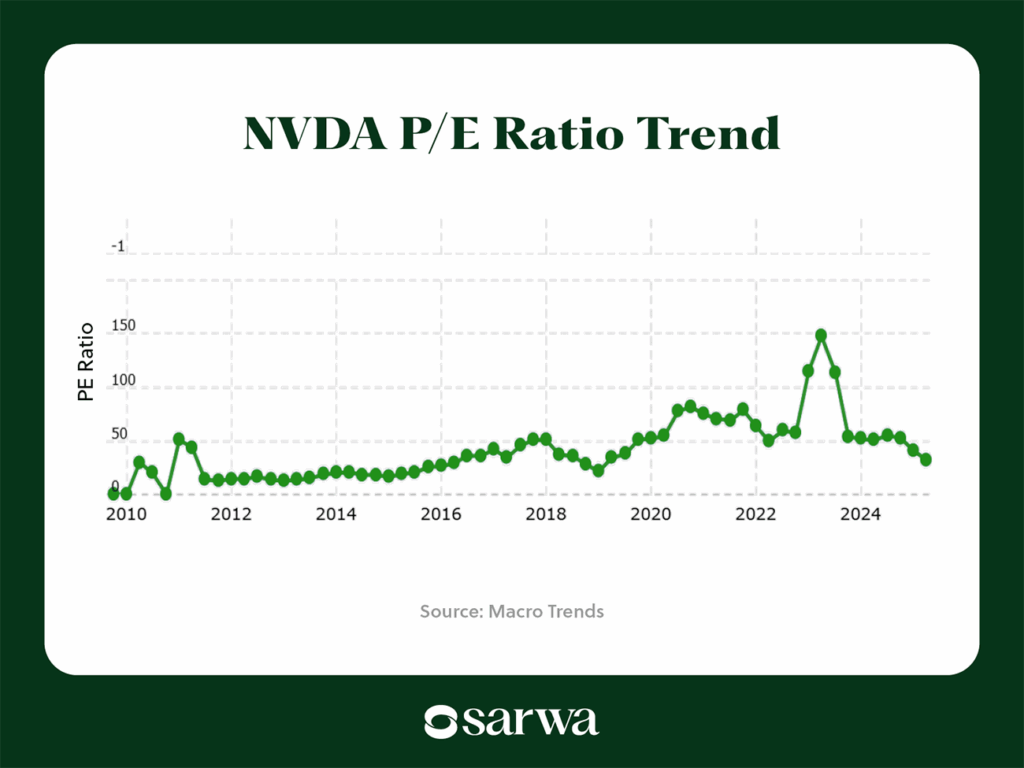
Source: Macro Trends
What can we deduce from this?
“The mean historical PE ratio of Nvidia over the last ten years is 51.73,” according to Full Ratio, a stock analytics platform. “The current 32.88 PE ratio is 36% below the historical average. Over the past ten years, NVDA’s PE ratio was at its highest in the Apr 2023 quarter at 138.75, with a price of $27.75 and an EPS of $0.2. The Apr 2015 quarter recorded the bottom point at 18.37, with a price of $0.55 and an EPS of $0.03.”
In other words, NVDA is currently undervalued based on historical trends.
The downside of this approach is that historical trends do not tell us what the P/E ratio should be. Though the historical average P/E ratio of NVDA over the past ten years is 51.73, nothing tells us that this is an ideal figure that we must always aim for since fundamental changes in earnings capacity and growth prospects can occur.
What it can tell us however is whether changes in P/E ratio are being driven by general market conditions or company-specific factors. If the P/E ratio rises only when we are in bull markets (where low interest rates make investors willing to accept higher P/E ratios) and it falls when we are in bear markets (where high interest rates make investors willing to accept lower P/E ratios), then the historical trend reflects general market conditions rather than company-specific factors.
On the other hand, if the P/E ratio is rising consistently through bull and bear markets, then it may imply that investors believe the company has high growth potential. The opposite is also true.
Also, a stable P/E ratio can be an indicator of stability of earnings while irregular P/E ratio reflects high earnings volatility. In essence, historical P/E ratio can be a measure of risk.
Don’t use the P/E ratio in isolation
We have said that the P/E ratio is just one of the comparables valuation metrics and using it in isolation can lead to poor investment decisions. You should use the other ones, compare them with each other, and then find the average fair price across the methods.
If you have the relevant skills, you can also consider other valuation methods like Discounted Cash Flow (DCF) valuation and dividend-based valuations (whether based on dividend yield, dividend per share, dividend payout ratio, or dividend growth rate, among others).
The bottom line is that all valuation methods are subjective. Two people using the same method can arrive at different figures.
This is why value investors like Warren Buffett emphasize the importance of a margin of safety. If you use a 20% margin of safety, for example, then a stock must be trading at least 20% below its intrinsic value before you can purchase it. That 20% discount serves as a cushion that protects you even if your valuation is not entirely accurate.
Finding and buying undervalued stocks is one of the time-tested investment strategies that investors have used to build wealth from the share market. Sarwa is a trading platform in the UAE that allows you to execute this strategy in a cost-effective, simple, safe, and accessible way.
You can buy and sell stocks with low commissions and transfer money from your local UAE bank account for free. The Sarwa app is easy to use and users are protected using bank-level SSL security. Also, you don’t need to have all the money in the world to get started. With just $1, you can start buying US stocks from the UAE.
Moreover, Sarwa provides you access to the US stock market where the most valuable companies in the world are listed.
Are you ready to build wealth by buying undervalued US stocks? Sign up for Sarwa and start building wealth through smart investing.
Takeaways
- The price-to-earnings ratio is calculated by dividing a stock’s price by its earnings per share (EPS). A high P/E may signal overvaluation or strong growth expectations, while a low P/E might indicate undervaluation—or trouble.
- Because growth prospects, risk levels, and capital structures vary across sectors, the P/E ratio is most useful when comparing a company to its peers or industry average—not companies in different sectors.
- The PEG ratio (P/E divided by projected growth rate) adjusts for growth expectations, helping you avoid misjudging high-growth companies as overvalued. Historical P/E trends can also offer clues about whether a stock is undervalued relative to its own past performance.
For a more accurate intrinsic value, investors often combine several ratios (like P/S and P/B) or use other models like DCF. And since no valuation method is perfect, applying a margin of safety (e.g., only buying a stock that trades 20% below its estimated fair value) adds a cushion for error.