
You have heard about the role of gold as a safe haven during economic downturns, a good store of value, and a portfolio diversifier. This has made it a good investment asset that has provided stability for investors.
But do you know that gold is also a good asset for traders? It satisfies the two main conditions that make an asset appropriate for trading: liquidity and volatility.
The gold market is very liquid. Its average daily trading volume is $232.84 billion per day across exchanges (including gold bullion and derivatives like gold futures and gold options), OTCs (including CFDs, futures, and options), and ETFs, according to the World Gold Council, the gold industry’s brain trust
This is comparable to that of major stock indices (like the Dow Jones Industrial Average), fixed-income instruments (like US Treasuries and German Bunds), and currency spreads (including Euro/sterling, Euro/yen, among others).
Similarly, gold’s annualised volatility is currently 17.75%, which is higher than that of US corporate bonds, US Treasuries, and stock market indices like MSCI Emerging Markets and MSCI World ex-US.
Yet, like every financial asset (forex currency pairs, stocks, and ETFs, etc.), you need a solid gold day trading strategy to make consistent profits. Gold trading should be approached not as a coin toss but with a detailed plan that can make you money.
In this article, we consider 5 of the most popular gold day trading strategies and how you can execute them step-by-step. We’ll cover:
- Trend following strategy
- Momentum trading strategy
- Range trading strategy
- Break of structure and change of character strategy
- Mean-reversion strategy
Do you want to learn more about the importance of gold as an asset for investors and traders? Subscribe now to Sarwa’s Fully Invested newsletter for more information about alternative asset classes like gold.
1. Trend following strategy
Trend following remains one of the most successful day trading strategies that applies across diverse financial markets, including the gold market.
The basic tenet of this gold day trading strategy is that you should trade in the direction the market is already going. If the market is on an upward trend, for example, then you should be going long (buy low then sell high) when there is a pullback and never short (sell high then buy low).
There are three basic components of a trend following strategy:
Deciding trend direction
Since the basic principle is to follow the trend, the first task is to decide the trend’s direction.
There are many ways to do this.
The first is to check if the price chart is making higher highs and higher lows (uptrend) or lower highs and lower lows.
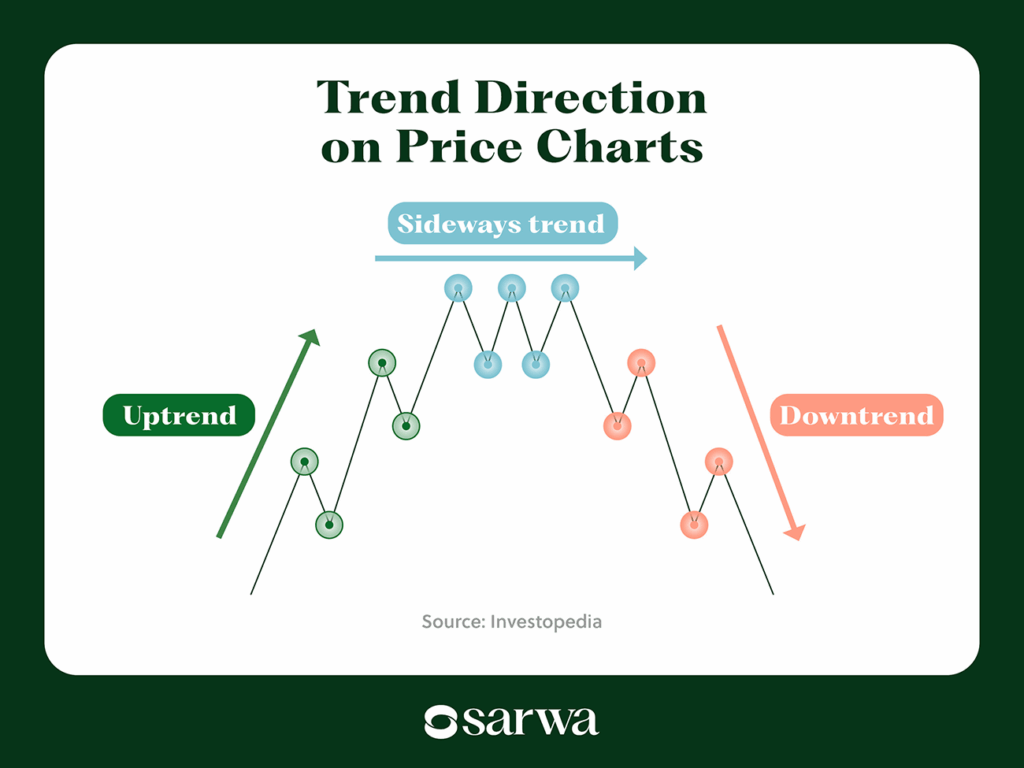
A second option is to use moving averages. A moving average is a line showing the average price of an asset over a specific period. This line is dynamic, changing as new price information is added and older ones are removed.
There are two types of moving averages: simple moving averages (SMA), which assign equal weight to all prices, and exponential moving averages (EMA), which give greater weights to more recent prices. Some of the most common moving averages are 50SMA, 200SMA, 9EMA, and 12EMA, among others.
Rising MAs represent an uptrend (or bullish market), while falling MAs represent a downtrend (bearish market).
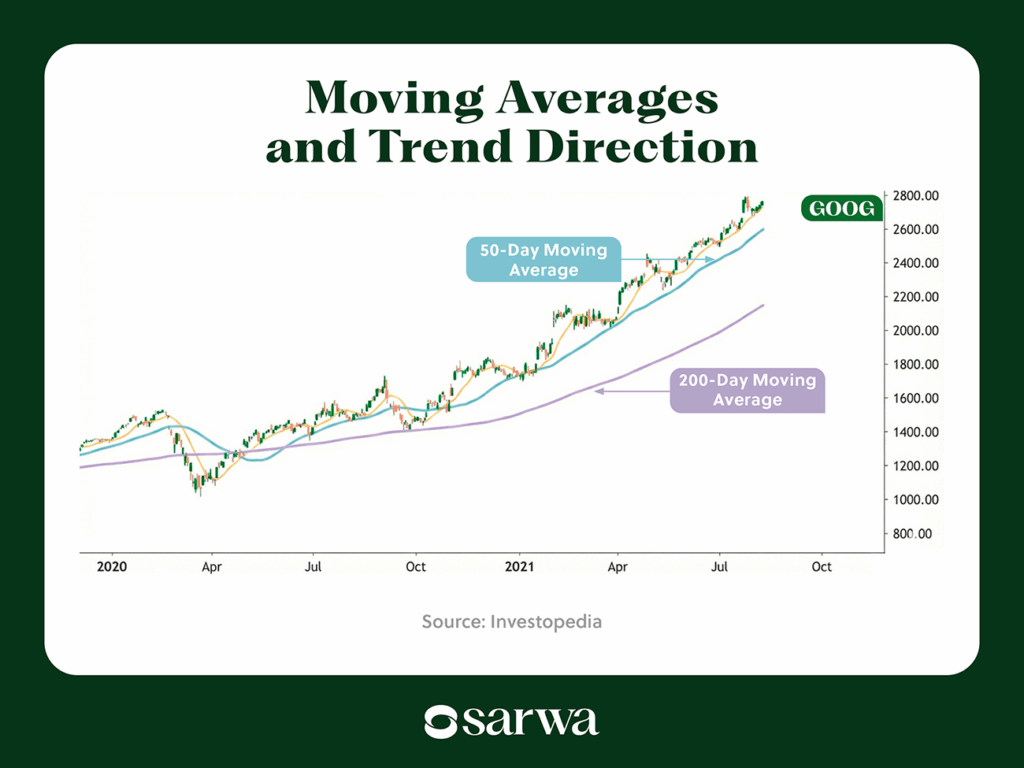
Source: Investopedia
In this chart, both the 50MA and the 200MA are rising, which suggests that we are in an uptrend. This aligns with the higher highs and higher lows that we see on the price chart.
Finding an entry
Once the trend is clear, your next task is to find an entry. To reiterate, you look for buys in an uptrend and sells in a downtrend.
Trend followers use multiple entry strategies. We’ll cover some of them below. However, the most important point is that you can’t rely on a single entry strategy. While one principle can be the main one, there is a need for another, which will serve as confirmation.
What are some of these popular entry strategies?
- MA crossover: When a short-term MA (say 50MA) crosses a long-term MA (say 200MA) from below, there is a likelihood that the price will go up, and vice versa.
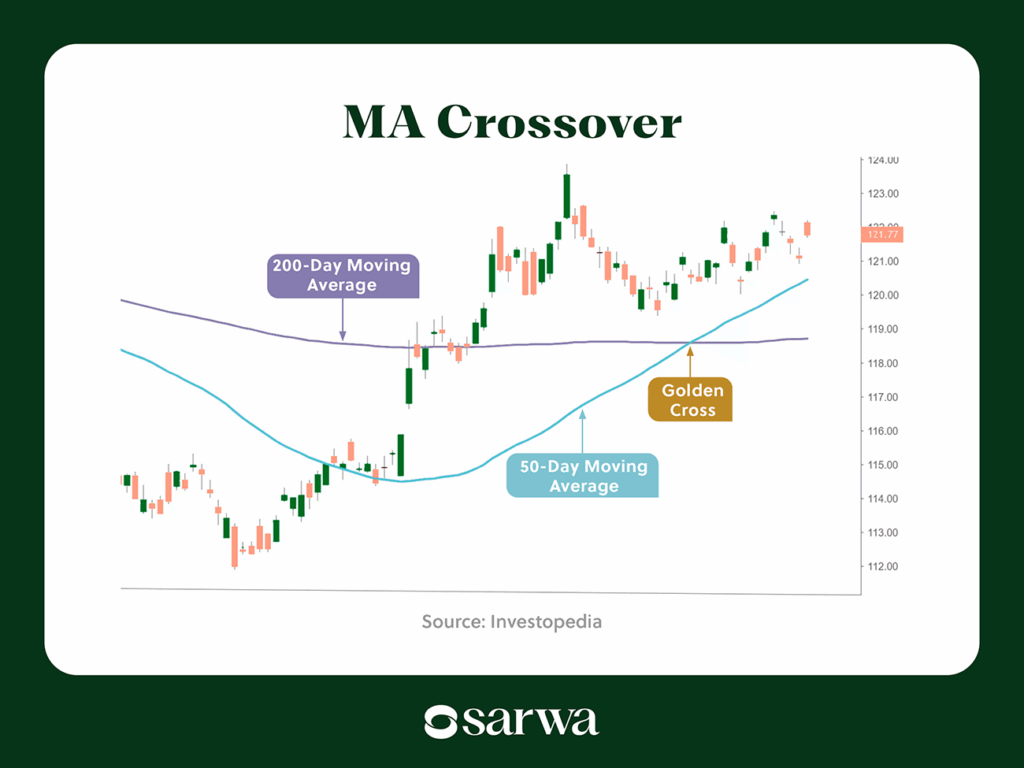
Source: Investopedia
In this example, the 50MA crosses the 200MA from below, which signals the start of a bullish reversal. That point where the golden cross happens becomes an entry point, subject to additional confirmation.
- MACD crossover: MACD is one of the top technical indicators for day trading. The MACD line crossing the signal line is another signal that a trend reversal is about to start. If it crosses from below, it is an uptrend, and vice versa.
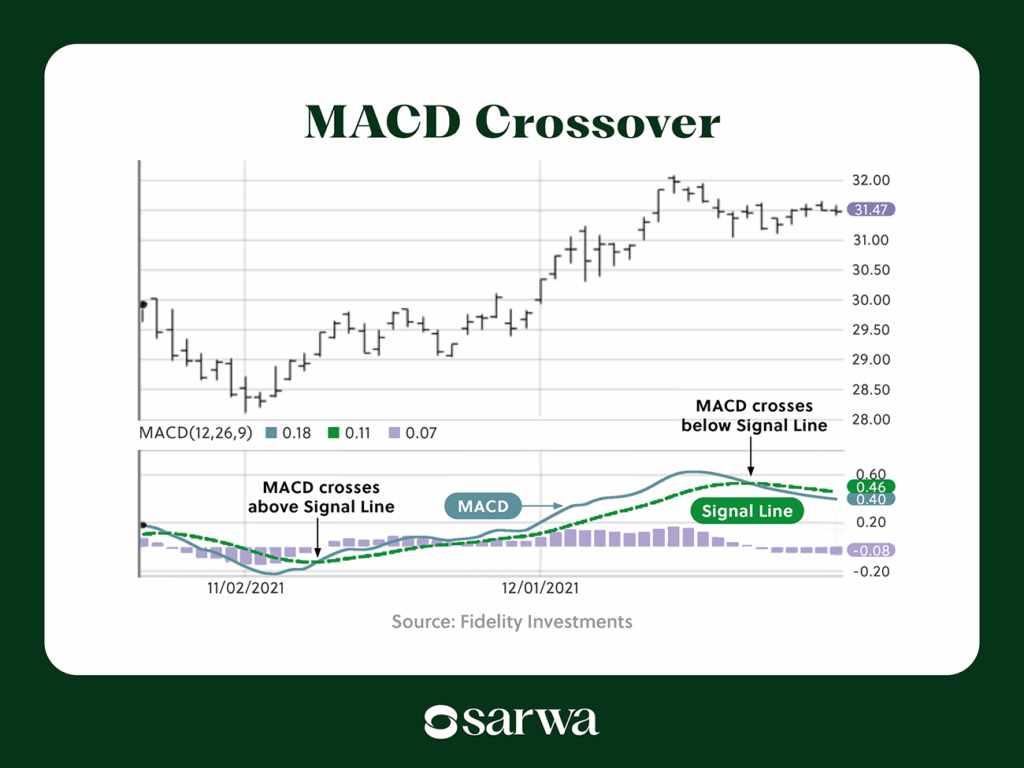
Source: Fidelity Investments
- Trendlines: A trendline shows the dynamic support and resistance levels in a trending market. Below is an example:
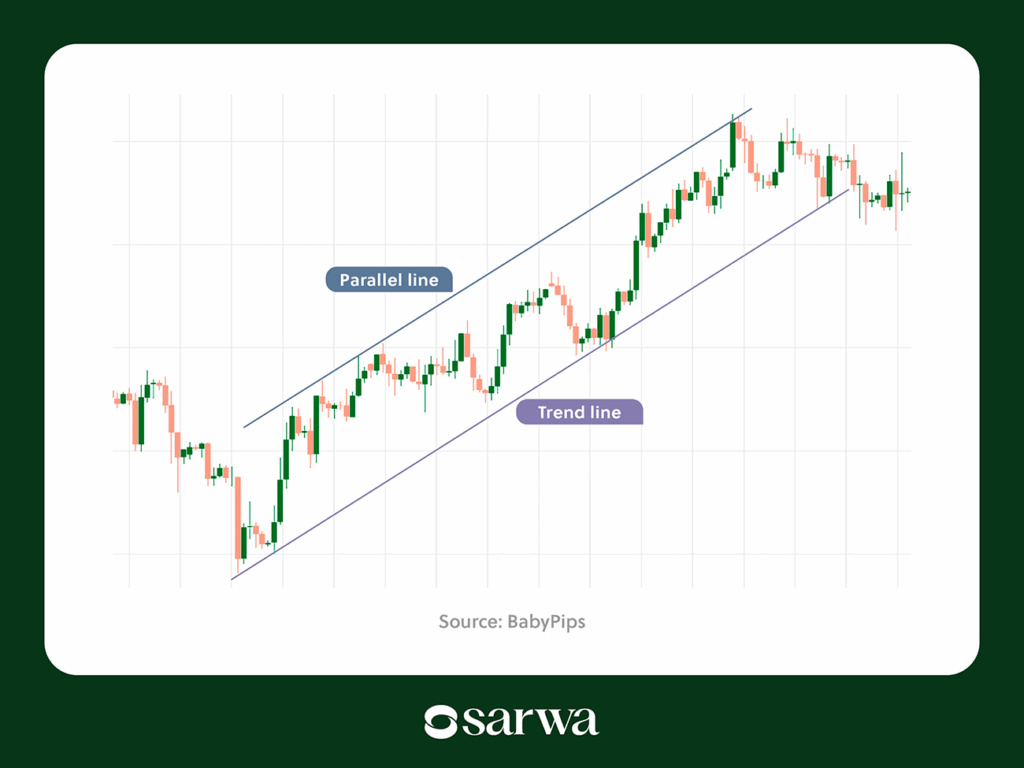
Source: BabyPips
In this example, we have a clear uptrend. Thus, all the trades you will take must be buys.
For the trendline entry, you buy when the price is at support (the trend line) and sell when it reaches resistance (the parallel line). In a downtrend, the trend line will be above, while the parallel line will be below.
- Candlestick patterns: One, two, or three candlesticks can form patterns that can help indicate when the market is likely to continue moving in a given direction or change course.
Below are key candlestick patterns and what they indicate:
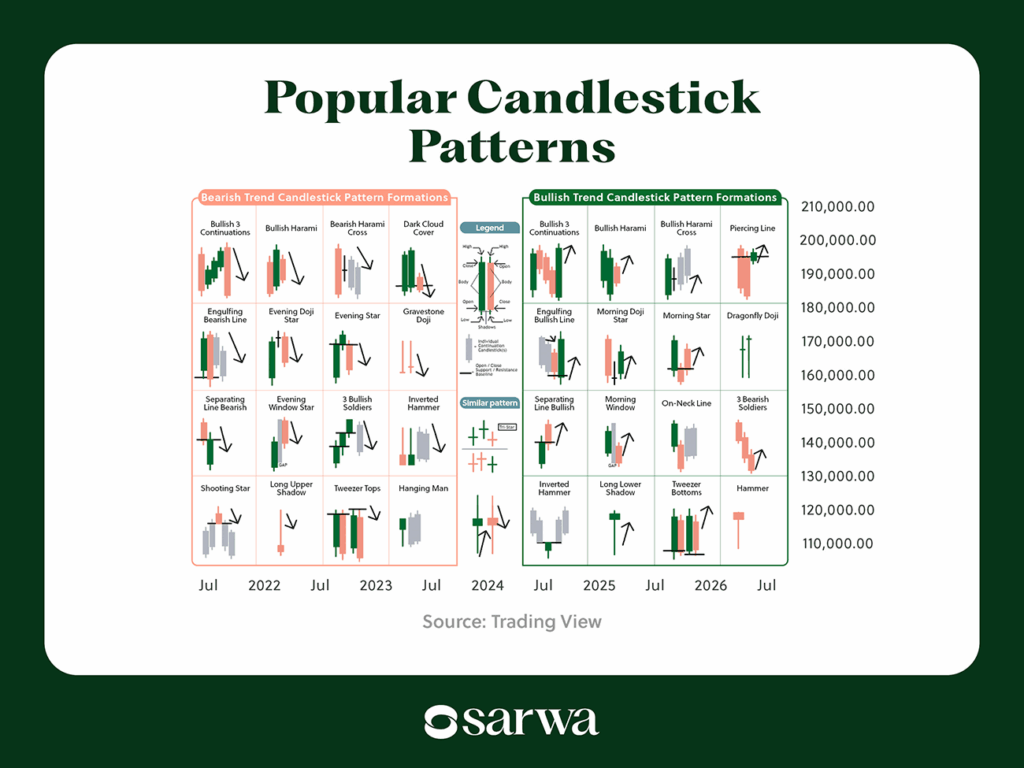
Source: Trading View
- Chart patterns: Chart patterns are price action structures that indicate whether the price will continue its current trend or reverse. Some of the popular ones include:
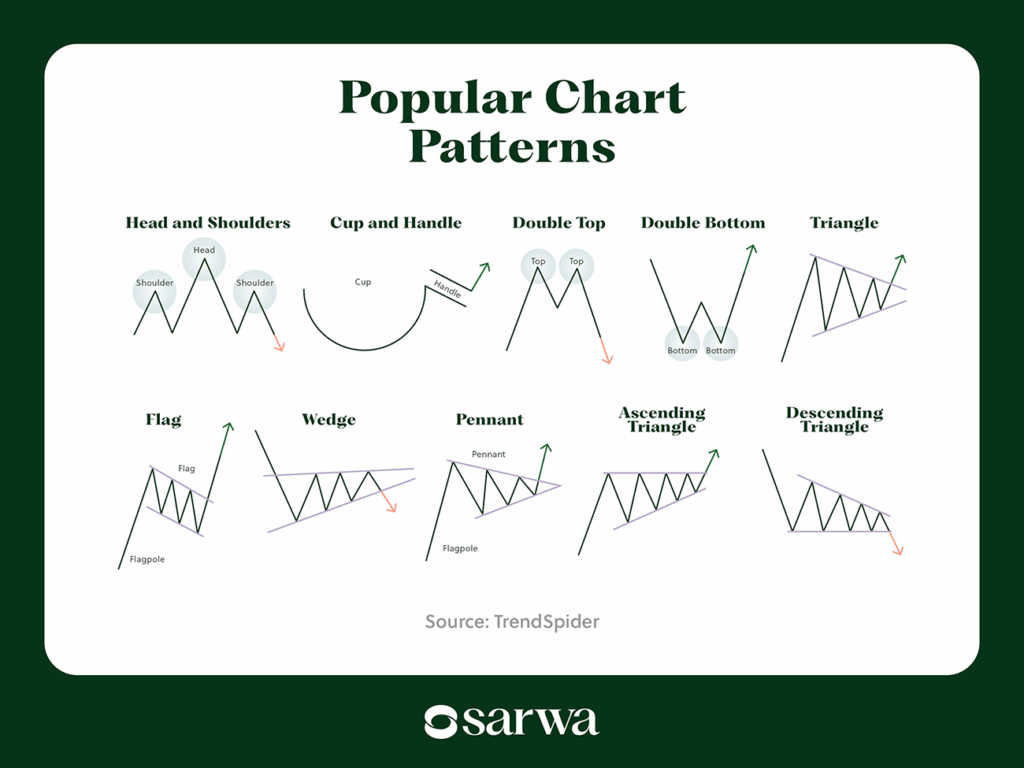
Source: TrendSpider
Finding an exit
After entering a trade, you need to decide when to exit. You can exit by taking profits or cutting short losses when the price of gold reaches a particular level.
Most experienced traders determine the take-profit and stop-loss prices through their risk management strategy. This involves deciding how much to risk on a single trade (as a % of your portfolio), what risk-to-return ratio makes sense (a 1:3 ratio is popular), and using both to select a stop-loss price.
Some also use technical indicators to set stop losses. Some common examples are the average true range (ATR) and the parabolic SAR.
The ATR is a measure of the market’s volatility or price fluctuations. It does this by calculating the average range between high and low prices over a given period, usually 14 days.
Traders use it to set a stop loss by deducting (when going long) or adding (when going short) a multiple of the ATR to their entry price.
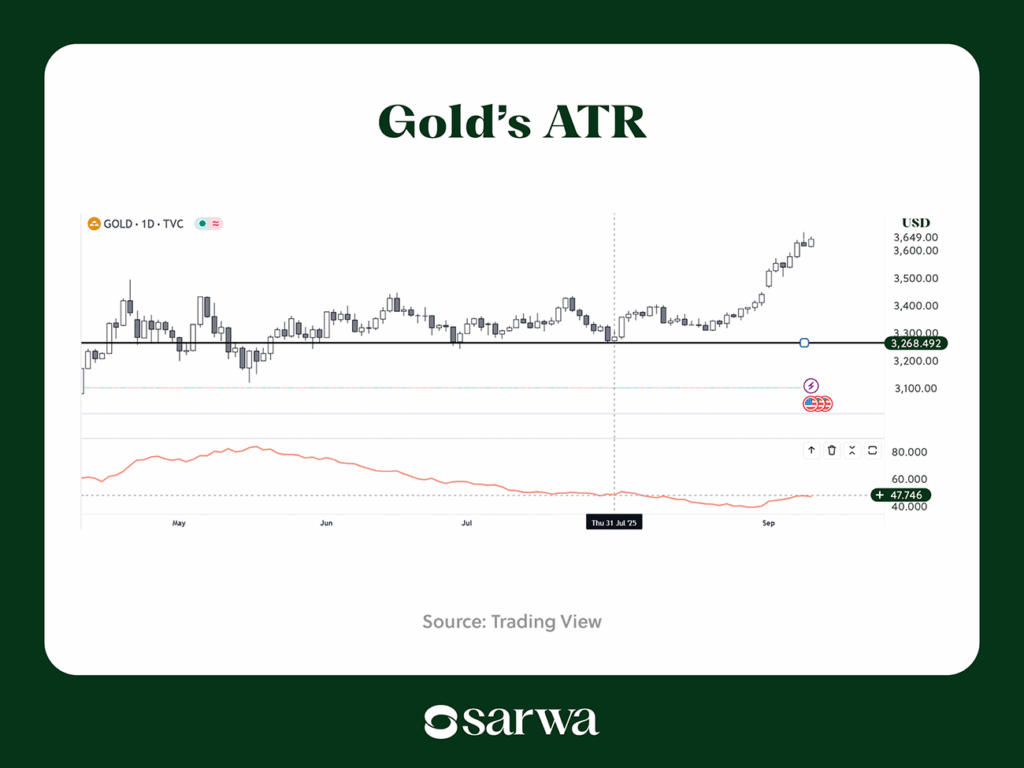
Source: Trading View
Let’s assume you want to go long on gold on July 31 at the support line. At that point, gold’s ATR was 47.746. If you use 2 ATR as your stop loss, then you will deduct 95.492 from gold’s price ($3,268.492) and set the stop loss at $3,173.
The parabolic SAR is another useful tool for this.
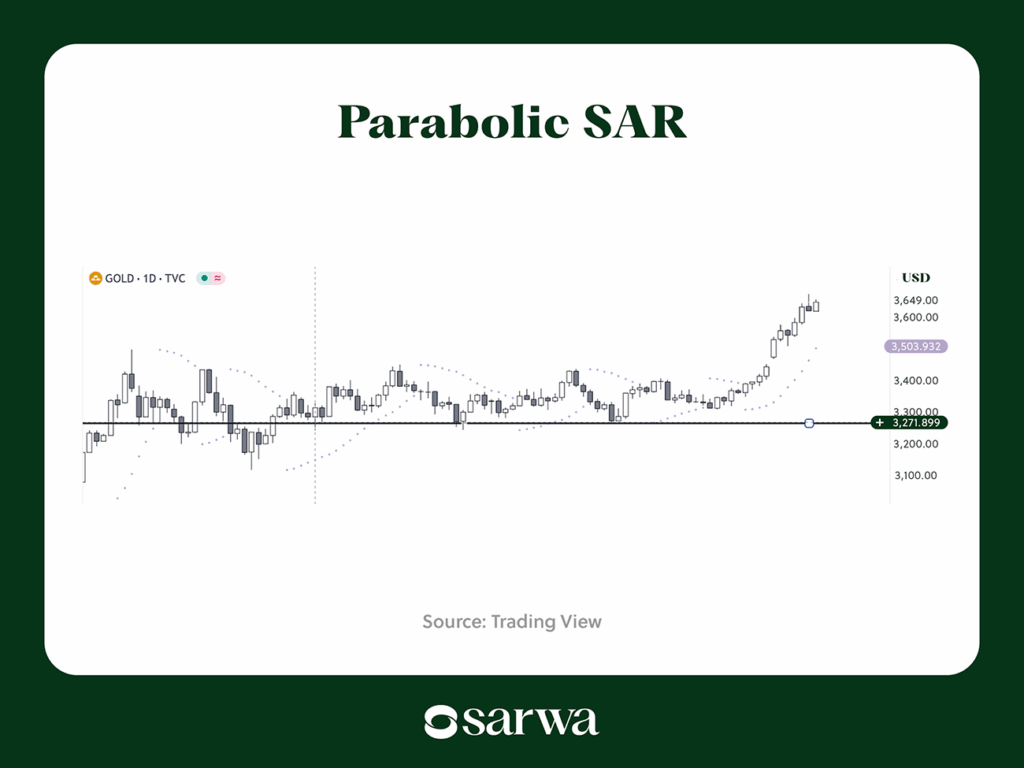
Source: Trading View
If you go long on May 29 (where the vertical broken line is), then you can put your stop loss where those blue lines are.
Tips for executing this gold day trading strategy
- Master technical analysis: Understanding technical analysis is a prerequisite for trading gold or any other financial asset. Without it, it is impossible to trade based on a plan or strategy.
All the fundamental analysis you need to know is that gold is liquid and volatile. Focus your energy on technical analysis.
- Use multiple entry strategies for confirmation: If you select only one entry strategy, you will have many false entries. It’s a good idea to combine multiple strategies and wait for them to cohere before taking a trade.
- Use the right timeframe: As a day trader, stick to 5-minute, 15-minute, 30-minute, 1-hour, and 4-hour timeframes. Those shorter timeframes will provide the relevant information you need to open and close trades within a day.
- Consider using an options trading strategy: If you want to profit from the price movements of gold while using leverage, you can execute your trend-following strategy using options. You can buy a call option when you are bullish on gold and a put option when you are bearish.
2. Momentum trading strategy
Momentum trading combines trend direction (emphasized by trend followers) with trend momentum. In essence, a trend’s momentum is the strength of the trend.
Interestingly, the whole point of a trend’s momentum is to help predict if the trend will continue in its direction or reverse.
When a trend is strong (high momentum), the trend will likely continue, and vice versa. Also, when a weak trend grows stronger, the trend will likely continue, and vice versa.
Some of the approaches to gauging a trend’s momentum are:
- MACD indicator: The MACD indicator has a histogram that helps to identify a trend’s strength.
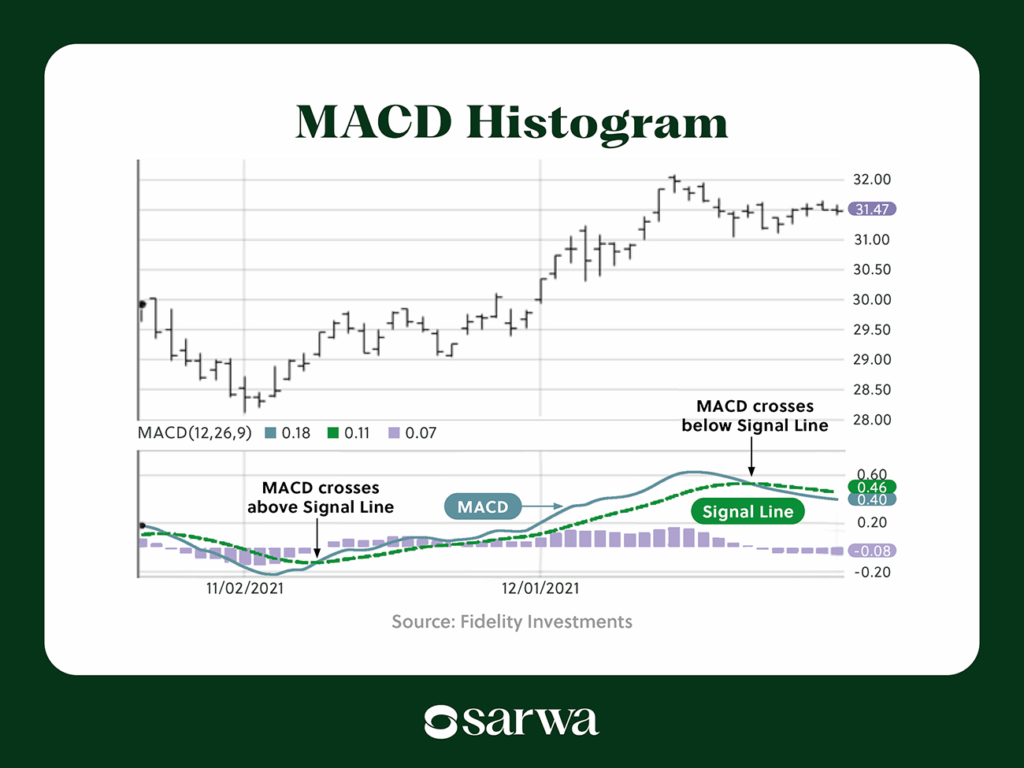
Source: Fidelity Investments
The trend is weak when the histogram is smaller and strong when it is bigger. Also, the trend is getting stronger when the histogram moves from smaller bars to bigger bars and weaker when the histogram moves from larger bars to smaller bars.
- RSI indicator: The RSI indicator is one of the most popular momentum oscillators used by traders (especially in forex trading).
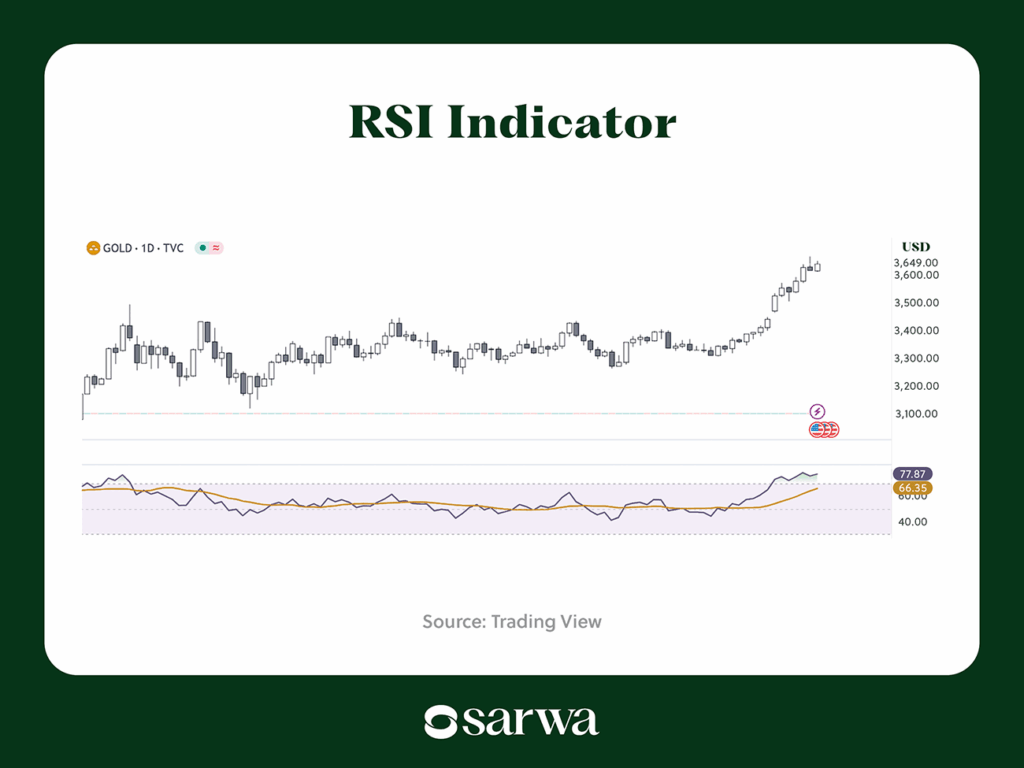
Source: Trading View
The trend is strong when the RSI indicator (the purple line) is above 50 (the horizontal broken line) and weak when it is below it.
- Momentum Indicator (MoM): Momentum is another popular momentum oscillator. It operates just like the RSI indicator, except that the key number is 100 instead of 50.
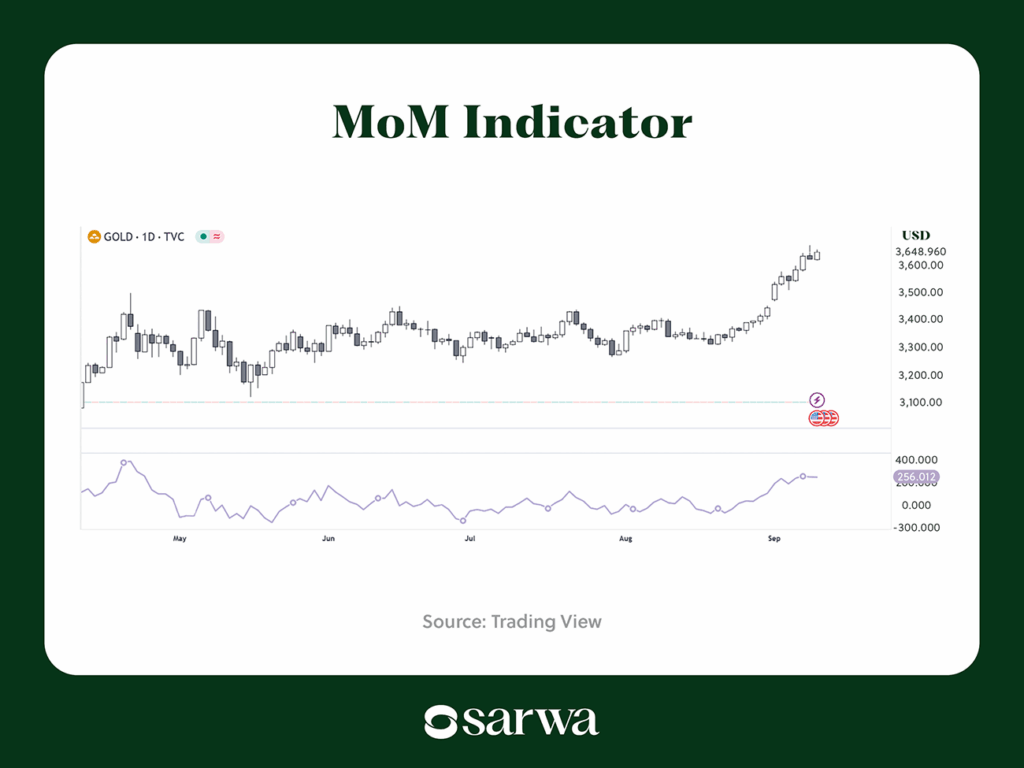
Source: Trading View
- Bollinger bands: The bollinger band consists of three lines: the middle band (a 20SMA), the upper band (20SMA plus 2 standard deviations), and the lower band (SMA minus 2 standard deviations).
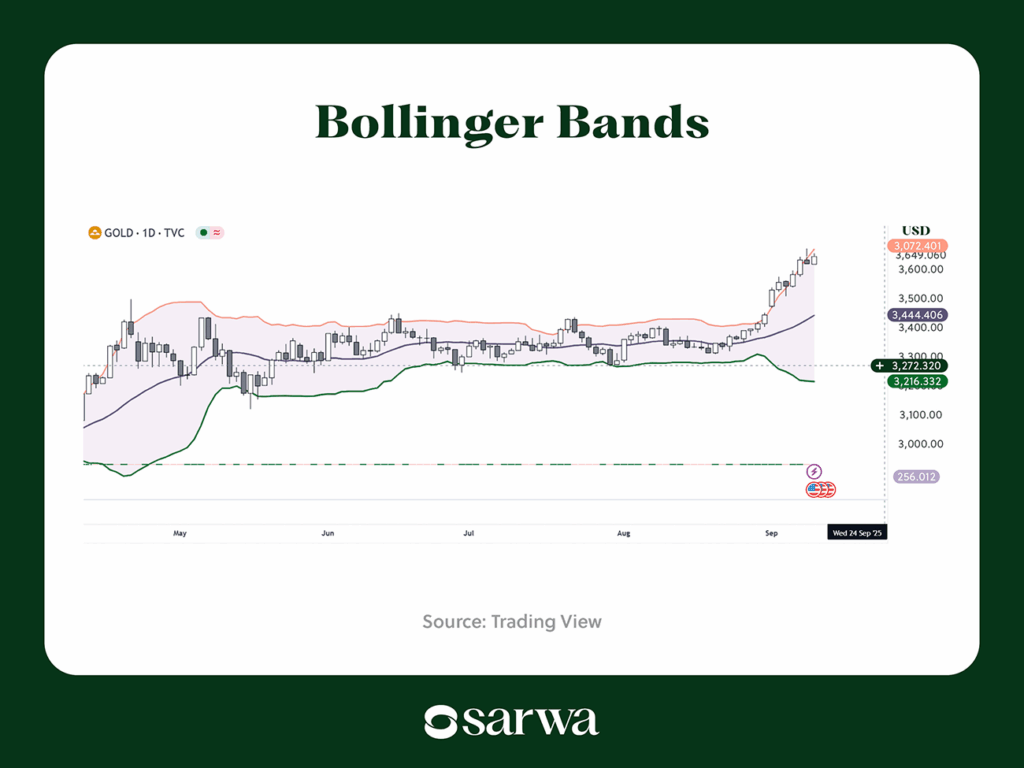
Source: Trading View
Momentum is strong when the BB expands (May, June, and September in this example), and it is weak when it squeezes (July and August).
Momentum traders often use any of the entry strategies we covered under the trend following strategy (among others) to confirm that the trend will continue or reverse. Only then will they enter a trade.
Tips for executing this gold day trading strategy
- Use multiple indicators: It’s wise to use multiple indicators to confirm the strength of the trend.
- Pay attention to the news: Macro events like economic data releases, interest rate and inflation rate announcements by central banks, and geopolitical tensions, which often result in economic uncertainty, can affect gold’s momentum against the US dollar.
A good momentum trader skilled at monitoring the economic calendar can take advantage of the trading opportunities provided by such news events.
- Know when to quit: A strong momentum you are riding may weaken unexpectedly (for whatever reason). There’s always the temptation to remain in a trade, hoping the trend will soon reverse. However, it is prudent to cut short your losses (using stop-loss orders) instead of chasing the wind.
3. Range trading strategy
The two strategies we have covered are perfect in trending markets (where there are clear uptrends and downtrends). In contrast, range trading is appropriate in ranging or consolidating markets.
Below is an example of what a ranging market looks like:
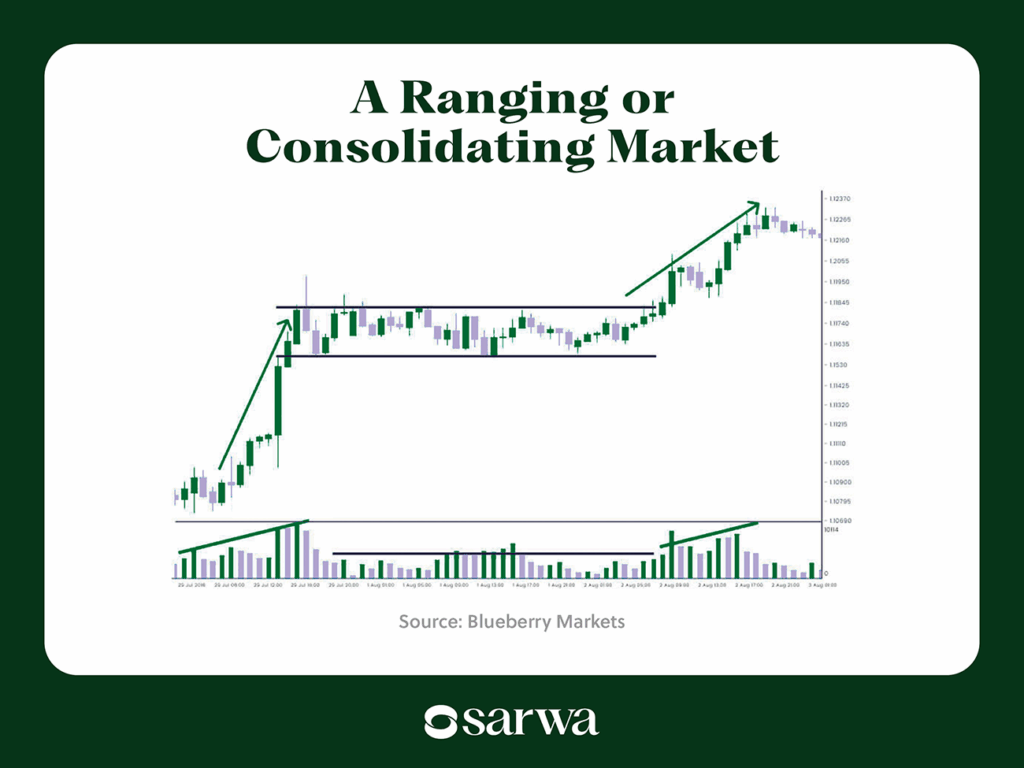
Source: Blueberry Markets
Traders in this market will go long at (or close to) support (the horizontal line at the bottom of the range) and sell at (or close to) resistance (the horizontal line at the top of the range). Alternatively, they can short the market at resistance and close the trade at support.
Some range traders also use the BB instead.
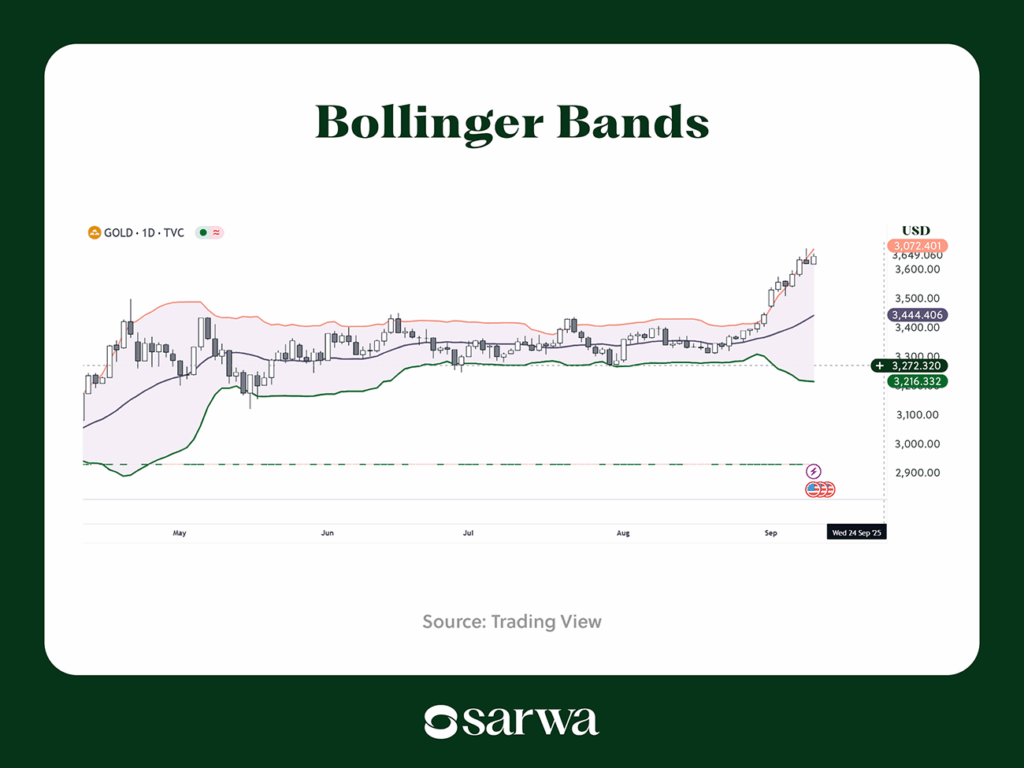
Source: Trading View
Some will buy gold at the lower band and sell gold at the upper band (and vice versa). Those with lower risk tolerance will buy once the price crosses the middle band and sell at the upper band (and vice versa).
Tips for executing this gold day trading strategy
- Identify clear support and resistance zones: Your ability to identify support and resistance zones is key. Ensure that the price has respected the zone multiple times, and volume data also support increased momentum at those zones.
- Use indicators: Indicators can help you identify overbought conditions at resistance and oversold conditions at support. This can help you decide when to buy and sell.
- Best to avoid the middle of the range: It’s best to wait for the price to come near support or resistance before buying or selling. Longing or shorting in the middle of the range is risky and unadvisable.
- Use candlestick patterns for confirmation: Again, a single entry strategy is risky. Candlestick patterns are often the best confirmations for range traders. The use of confirmations will protect range traders from unexpected breakouts.
- Break of structure and change of character strategy
When price rises above a previous high or below a previous low, there has been a break of structure (BoS).
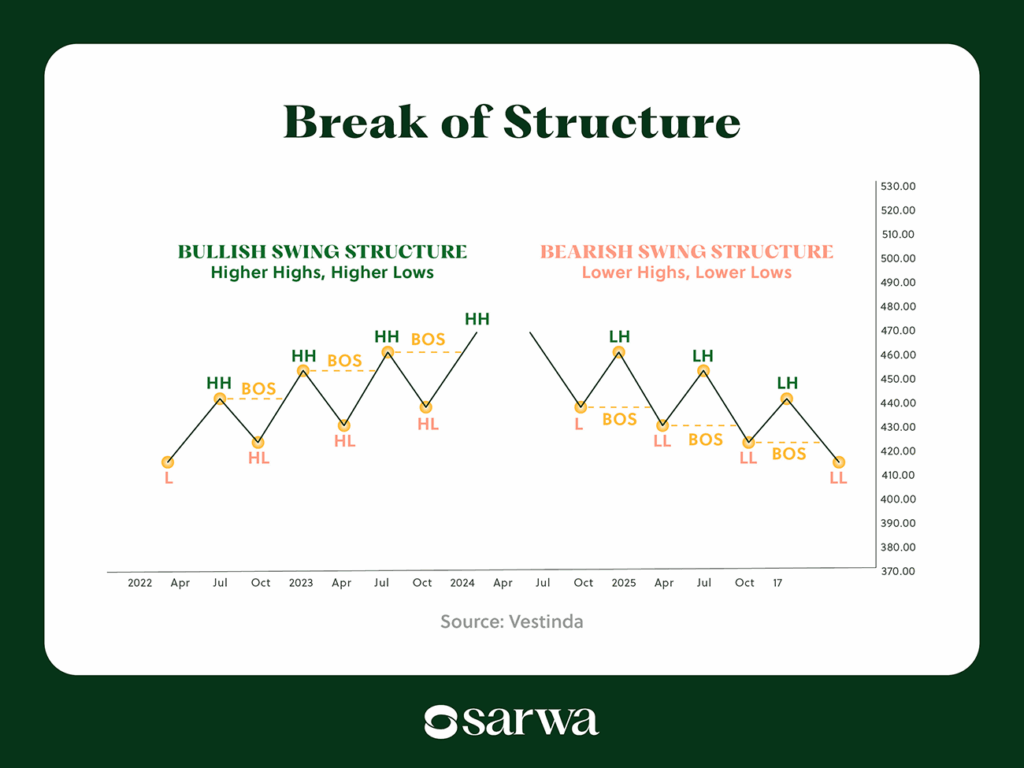
Source: Vestinda
When a BoS occurs on a chart, it is a confirmation that the market trend is strong and is likely to continue.
On the other hand, a change of character (CHoCH) shows that a trend reversal is likely as price fails to make a higher low (in a bullish market) or lower high (in a bearish market). As a result, market conditions change and the uptrend turns to a downtrend, and vice versa.
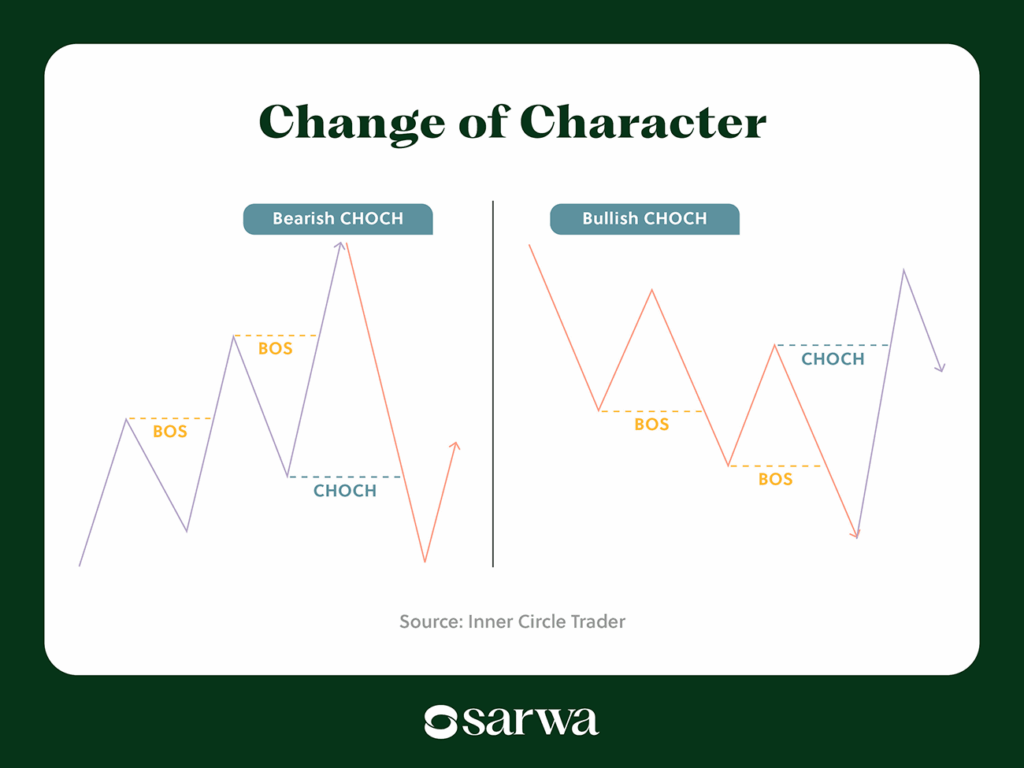
Source: Inner Circle Trader
Those who use this CHoCH strategy will often wait for a BoS in the new direction to confirm that a new trend has truly emerged.
Also, BoS and CHoCH are more likely to accurately predict continuations and reversals when they happen at key supply and demand zones or where fair value gaps already exist.
Tips for executing this gold day trading strategy
- Use confirmation for entries: Candlestick patterns, supply and demand zones, and fair value gaps can help to confirm if particular BoS and CHoCH are significant or not.
- Combine higher timeframes with lower timeframes: Use the former to identify key zones and the latter for entry.
- Wait for candle closure to confirm BoS and CHoCH: The wick of a candle going past a previous high or low is not enough; the candle must close above those points to confirm a BoS. Also, the candle must close below a previous or above a previous high for a CHoCH to confirm a CHoCH.
5. Mean-reversion strategy
A mean-reversion strategy is based on the assumption that the long-term correlation between two assets should continue to hold. Thus, when there is a deviation from this pattern, a reversion to the mean should be expected.
For example, the historical mean of the gold/silver ratio is around 60. When this average increased to 100 in 2025, some traders were going long on silver and shorting gold with the expectation that a reversion to the mean would occur.
Day traders can also use this strategy by identifying the average daily spread between gold and silver (or other precious metals with high correlation to gold) and highlighting when the spread moves away from the mean to some extreme value. They can then long the undervalued asset and short the overvalued asset.
Some day traders also use a mean reversion strategy that does not involve any other asset. Instead, they look at the moving average of gold and wait to go long or short when it deviates from it, with the expectation that it will return to the mean.
The BB is one indicator that helps with this. Some day traders will short at the upper band and close the trade at the middle band, while others will long at the lower band and close the trade at the middle band. Below is an example:
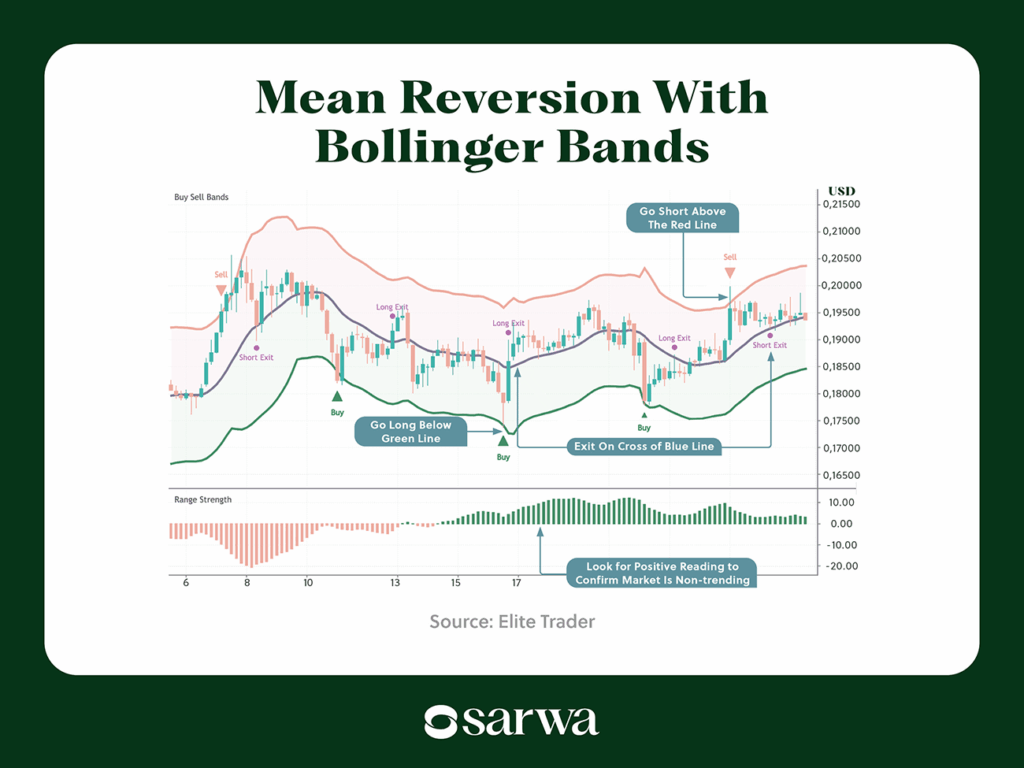
Source: Elite Trader
Some also use the RSI indicator for this. They will sell when RSI is crossing down from an overbought condition and buy when it is crossing up from an oversold condition. Below is an example:
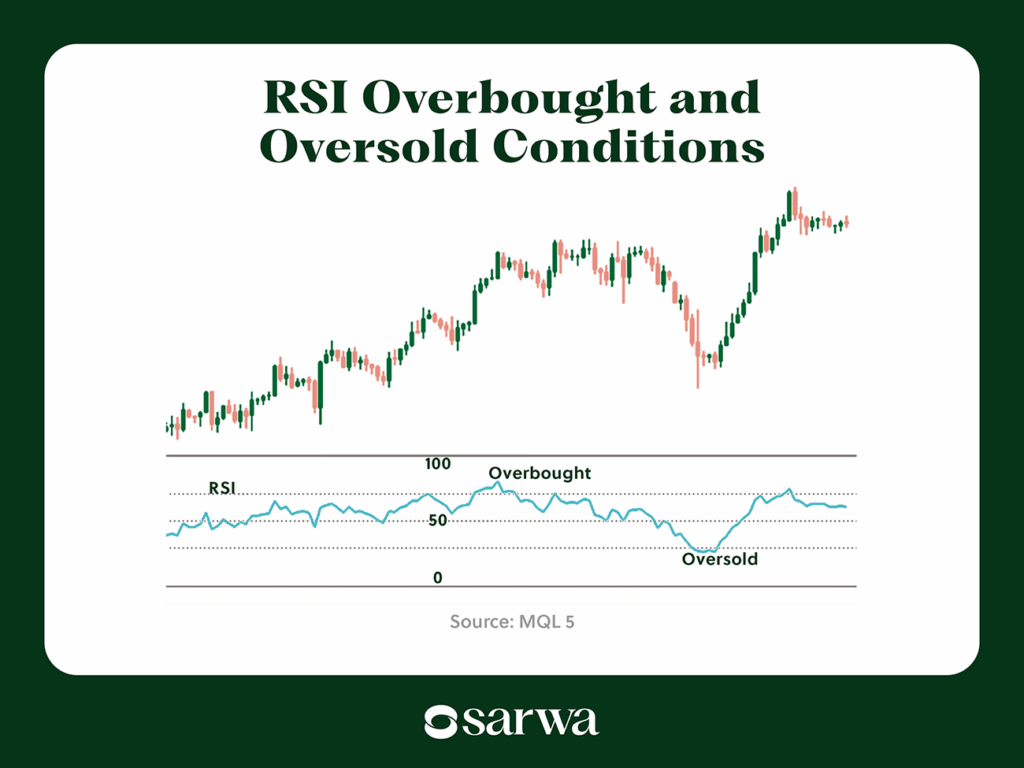
Source: MQL 5
Instead of selling when gold enters the overbought zone, they will wait for it to begin the retracement out of that zone. Similarly, instead of buying when it enters oversold territory, they will wait for it to start moving out of the zone.
Tips for executing this gold day trading strategy
- Use confirmations: Many traders have burnt their hands relying only on overbought and oversold conditions. In reality, an asset can stay in those zones for a while. Aside from waiting for the move out of those zones, you should use candlestick patterns to confirm an entry.
- Use mean reversion when volume is strong: A retracement to the mean is more likely to happen when there is strong volume to drive the price.
A final tip that is relevant to all these strategies is to backtest before using it in real-time. Backtesting is a process where you use your strategy on historical data to see how it would have performed. Though past performance does not guarantee future performance, backtesting gives you a trustworthy view of how well your strategy is likely to work.
How to trade gold in the UAE
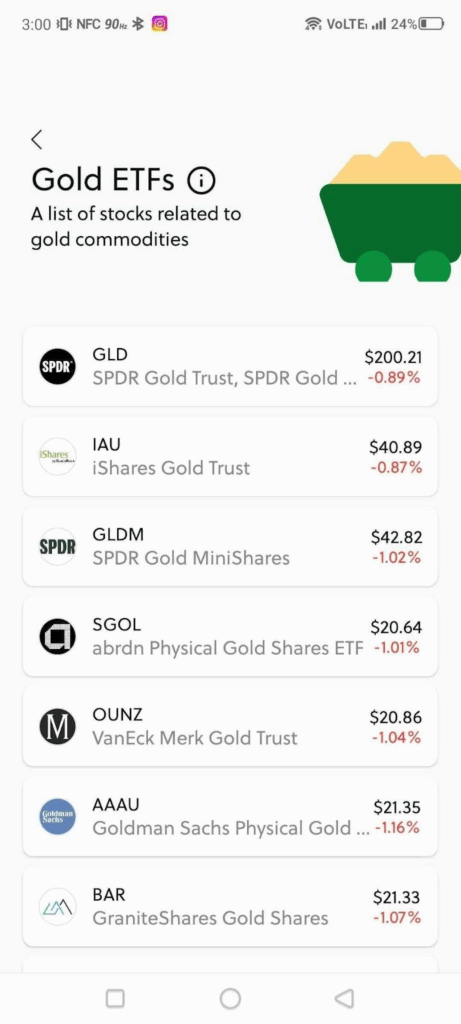
You can trade gold as an exchange-traded commodity (ETC), also known in some quarters as exchange-traded funds (ETFs), through the Sarwa app on the Google Play Store and the App Store.
Gold ETFs or ETCs invest in physical gold. Thus, their prices track the price of an ounce of gold (XAU/USD), and a share in them reflects exposure to physical gold itself.
A major advantage with ETC is that the fund managing it is responsible for storage; consequently, traders and investors don’t have to bother with taking delivery of physical gold or securing it, they can focus on profiting from the price movements of gold.
With Sarwa, you can open and close daily trades on different gold ETFs of your choice.
You can trade a fraction of a share of gold if you don’t have the capital to trade a share. You can start your trading journey with just $500.
You can also use limit and stop orders to execute your entry and exit at specific prices, based on your gold day trading strategy.
Also, transfers between your local UAE account and your Sarwa account are free. Our low commissions ($1 or 0.25% of traded value) also help to minimize the cost of trading, so you can keep more of your profits.
Furthermore, we protect your data and money with 256-bit bank-level encryption, and we are regulated by the Financial Services Regulatory Authority (“FSRA”) in the Abu Dhabi Global Markets (“ADGM”).
With Sarwa, you can start creating opportunities for profits by day trading gold from the comfort of your home.
Are you ready to become a gold trader? Sign up today for Sarwa to execute your gold trading strategies in a cost-effective, secure, and convenient way.
Takeaways
- Gold is not only a safe-haven asset but also a highly liquid and volatile market, making it perfect for trading.
- Popular gold day trading strategies include trend following, momentum, range trading, BoS/CHoCH, and mean-reversion.
- Successful gold trading requires mastering technical analysis, risk management, and using multiple confirmations.
- With Sarwa, traders in the UAE can easily trade gold ETCs with low commissions, free transfers, low minimum required capital, and high-level digital security.