
Technical analysis is at the heart of stock trading and there are top technical indicators for day trading that you must know and use to succeed.
Stock trading, in all its various forms, is all about making money from the short-term price movements of stocks. Success therefore requires that you become an expert at analysing past price data and then forecasting future movements.
Trading indicators (also known as technical indicators) are parts of the toolbox traders use to make this forecast. The better they get at understanding and using this tool, the more accurate their forecasts, which means a greater opportunity to make money.
In what follows, we will explain what technical indicators are all about and the top 6 indicators you must know how to use if you want to tread the path of other successful day traders. We’ll cover:
- What is day trading?
- Why do you need technical indicators?
- Six top technical indicators for day trading
- How to start day trading stocks in the UAE
[Do you want to learn how to manage your money and grow it through the stock market? Subscribe to Sarwa’s Newsletter for timely and proven personal finance and investing wisdom.]
1. What is day trading?
Day trading is a trading approach that involves completing a trade (buying and selling or selling and buying) within a day. A day trader can open a position (trade) and close it within some minutes, an hour, or a few hours; the key is that the trader tends to close many positions within the day (or short time frame) and does not tend to hold positions for the long term.
Day traders focus on intra-day (within the day) movements in the prices of stocks (and other asset classes, including forex) and position themselves to profit from them.
These intraday price movements can be due to general demand and supply dynamics or they can be the result of the market reactions to some news about the stock (earnings report, intending mergers and acquisitions, appointment of a new CEO, etc.)
As a form of risk management, day traders often follow various stocks and they open multiple positions on different stocks throughout the day. Consequently, day trading often requires a huge time investment and most day traders are full-time traders.
While day trading provides an opportunity to make daily profits, it requires discipline, expertise, and sound risk management. Interested beginners must take the time to learn the ropes before they start.
And one of the things you must learn is the role of stock technical indicators.
2. Why do you need technical indicators?
Technical indicators provide important data that stock traders use to predict or forecast future price movements of stocks. They are mathematically derived from other data like past prices, trading volume, and market psychology (or market sentiments).
While they are mathematically derived, they are plotted as a chart. As we will see below, some technical indicators are overlaid on the price chart while others are included just below the price chart.
The former are often referred to as overlays. Overlays use the supply and demand data of stocks to indicate overbought (too much buying pressure) and oversold (too much selling pressure) levels as well as to identify market volatility.
The latter (those included just below the price chart) are referred to as oscillators. These indicators oscillate (swing, move) between minimum and maximum prices to identify market momentum. They are also used to identify overbought and oversold levels.
Most of the time, traders use technical indicators to confirm a trend they have discovered from considering candlestick patterns, Fibonacci retracement, or moving averages (simple and exponential moving averages). If these three suggest that the market is on an uptrend (prices are going up), traders can confirm by adding a technical indicator.
Also, traders use technical indicators to decide when to enter and exit a position. If the indicator is of a particular form, they might take it as a signal that they should enter a trade and if it is of a different form, it might be a signal to exit.
For example, a trader might interpret an oversold level as the beginning of an uptrend or an overbought level as the beginning of a downtrend and then open long or short positions.
Ideally, traders use multiple technical indicators before making a final decision.
If two or more indicators are all agreeing that it is time to make an entry, this might be a more trusted signal than when only one indicator is signalling entry. On the other hand, if multiple indicators do not agree, a trader might decide to opt out of the trade.
There are tens of trading indicators that day traders will find on technical analysis trading software. However, it is impracticable to use them all. A more practical approach is to select the top technical indicators for day trading and then stick to them.
So, which are the top technical market indicators?
3. 6 top technical indicators for day trading
Below is a list of the top and most popular indicators favoured by expert day traders:
Bollinger bands
Bollinger bands are overlays. They are like an envelope overlaid on the price chart, as seen below:
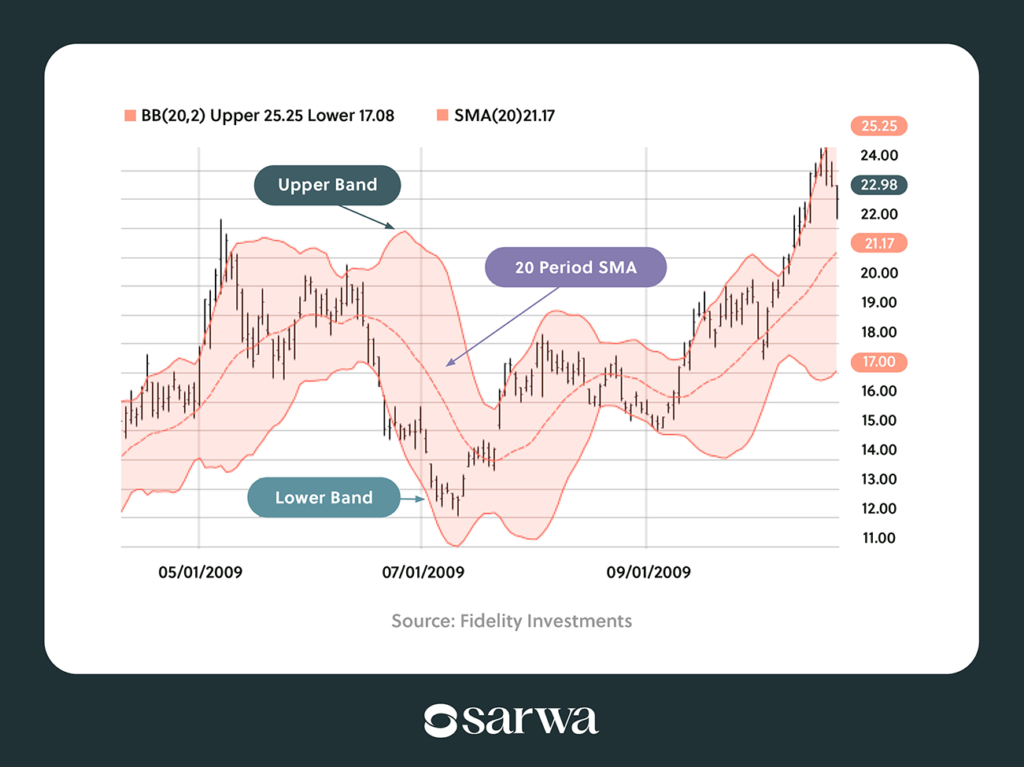
Source: Fidelity Investments
In the chart above, the Bollinger bands are the two blue lines above (upper band) and below (lower band) the price chart. (The middle blue line is the moving average).
Bollinger bands are mathematically derived from the standard deviations of prices from their simple moving average (SMA). A moving average is the average (mean) of price action within a period.
The upper band is the moving average (average price) plus the standard deviation and the lower band is the moving average minus the standard deviation.
Before using this indicator, you will need to decide the moving average you want to use (20-day, 50-day, 100-day, etc.) and the number of standard deviations (1.5, 2, or 2.5). If you use a 50-day moving average and 2 standard deviations, the upper band is the 50-day moving average plus 2 standard deviations and the lower band is the 50-day moving average minus 2 standard deviations.
How to use Bollinger bands
- Identification of overbought or oversold conditions: Standard deviations are used in mathematics to identify how far a variable has gone away from its average value.
Based on this understanding, traders use Bollinger bands to determine when a stock has been too far away from its average value – that is, when it has been overbought or oversold.
If prices in a period move to the upper bound (hugging the upper bound), it indicates that the stock has been overbought relative to its average value. On the other hand, if the prices are hugging the lower bound, it indicates that the stock has been oversold.
- Measurement of volatility: The volatility of a stock measures its fluctuations – how fast and how much it moves within a period.
When the upper and lower band tightens (also called a squeeze) – that is, when they get closer to each other – it indicates that volatility is low (prices are not deviating too much from their mean). The opposite – upper and lower band widening or getting far apart – indicates high volatility (prices are deviating too much from their mean).
Some traders believe that low volatility today is evidence of a coming increase in volatility or change in price trend and high volatility now is evidence of a coming reduction in volatility or the end of an existing trend.
- Identification of breakouts: When the price moves outside the upper or lower band, a breakout has occurred. Some traders see breakouts as indications of future price movements.
- Identification of a swing: Bollinger bands constitute a price range since prices tend to move from the lower band to the upper band, or vice versa. Therefore, some traders will wait for it to bounce off the lower band, buy when it is slightly above the moving average, and then take profit when it touches (or just before it touches) the upper band. They can also open a short position on the opposite movement.
Relative strength index (RSI)
RSI is an oscillator that moves between 0 and 100.
It measures the size of recent price changes and the speed at which those changes are occurring. RSI also compares the strength of a stock when prices are going up with when prices are going down.
RSI is usually calculated for 14 days. As more trading days occur, the RSI value adjusts to reflect the immediate past 14 days. When the number of days that prices are falling increases, the RSI moves down to indicate higher selling pressure, and vice versa.

Source: Investopedia
How to use the RSI
- Identifying overbought and oversold levels: Traditionally, a stock is identified as overbought when RSI crosses above 70 and oversold when it crosses below 30. For stocks that regularly cross 70 and 30, traders have used 80 and 20 as the benchmarks. However, in most cases, 70 and 30 remain the benchmark.
- Chart patterns: Common chart patterns like double top and double bottom also appear on the RSI indicator. The indicator also forms trends, with support (the price level where the stock stops falling) and resistance (the price level where the stock stops rising) levels. Some traders use these patterns when analysing candlestick patterns on the price chart.
- Trend indicator: In an uptrend, the RSI often stays between 40 and 90 while it stays between the 10 and 60 range during a downtrend. Traders can therefore use the RSI to identify an uptrend or a downtrend as well as to signal when a trend reversal is imminent.
One result of this is that pegging the benchmark for identifying an overbought level at 70 might not be accurate in a downtrend. Since the RSI ranges only between 10 and 60, it might not reach 70 during a downtrend but this does not mean it is never overbought within that period.
- RSI divergence: There are times when the market shows an uptrend with the price chart but a downtrend with the RSI indicator, and vice versa. These divergences can be evidence of a potential reversal and some traders use them as buy and sell signals.
Moving average convergence divergence (MACD)
MACD is another oscillator. It is an indicator of the direction and momentum of a market trend.
As seen below, the MACD indicator has two lines – the MACD line and the signal line.
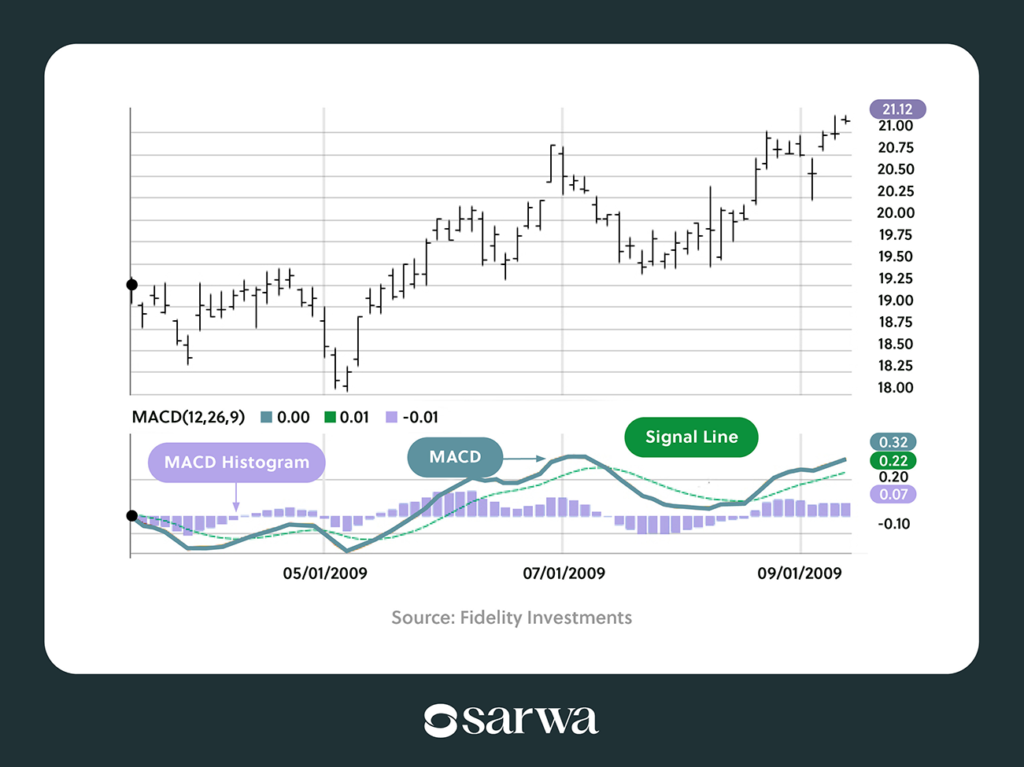
Source: Fidelity Investments
The MACD line represents the difference between two exponential moving averages with the most common being the 12 EMA and the 26 EMA.
As a difference between two EMAs, the MACD line shows how both converge or diverge over a given period. When the difference between them reduces, there is convergence and when it increases, there is divergence.
The signal line, on the other hand, plots the movement of the exponential moving average of the MACD line itself. It is usually the 9 EMA of the MACD line, showing how the average value of the MACD moves within the same period.
Finally, the MACD histogram plots the relationship between the MACD line and the signal line. When the histogram is positive, it shows that the MACD (represented by the MACD line) is currently above its 9-day average (represented by the signal line) and when it is negative, it shows that the MACD is below its 9-day average.
How to use MACD
- Trend indicator: When MACD crosses above zero, it indicates an uptrend (bullish market) and when it crosses below zero, it indicates a downtrend (bearish market).
Similarly, when the MACD line crosses the signal line from below, there is evidence of an uptrend and when it crosses from above, it indicates a downtrend. This is often referred to as the MACD crossover strategy.
- Momentum identification: A positive MACD histogram is evidence of an increase in uptrend momentum while a negative histogram indicates an increase in downtrend momentum.
- Price reversal: As in the RSI’s case, when the price chart shows a different trend from the MACD, it can indicate the beginning of a price reversal. For example, if the price chart is in a downtrend and MACD is in an uptrend, it can be evidence that the price is about to reverse to an uptrend.
Average directional index (ADI)
While MACD measures the direction of a trend, ADI measures its strength and momentum. That is, it confirms whether an uptrend or downtrend is strong and robust or weak and feeble.
ADI is the mean of the values represented by the directional movement (DM) lines.
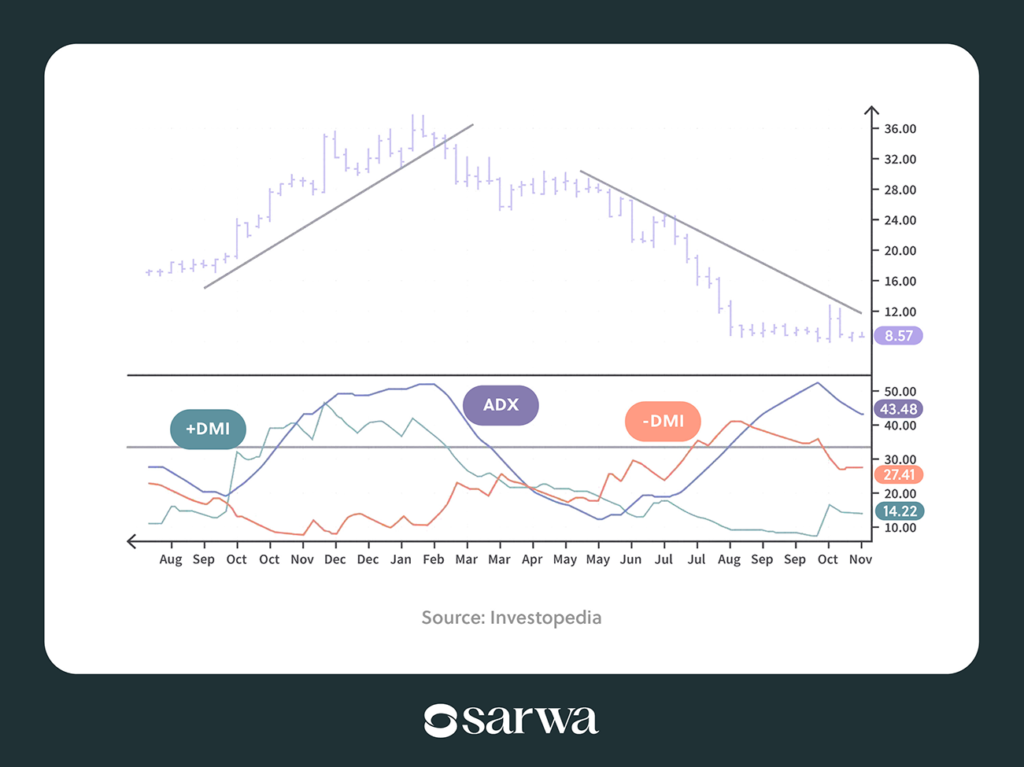
Source: Investopedia
The directional movement lines are either positive or negative. +DMI shows the difference between today’s and yesterday’s high prices added up over the past 14 days. On the other hand, -DMI shows the difference between today’s and yesterday’s low prices added up over the past 14 days.
While ADX shows the strength of the trend, the directional movement lines can jointly show the direction of the trend (see below).
Though the ADX line can chart between 0 and 100, it does not often go beyond 60.
How to use the ADI
- Momentum indicator: ADX above 25 indicates a strong trend (current market conditions will continue) and ADX below 20 shows that the trend is weak or there is too much volatility to even identify a trend.
- Trend direction: When the positive directional movement line is above the negative directional movement line, then we are in an uptrend. The opposite is also true.
Momentum Oscillator
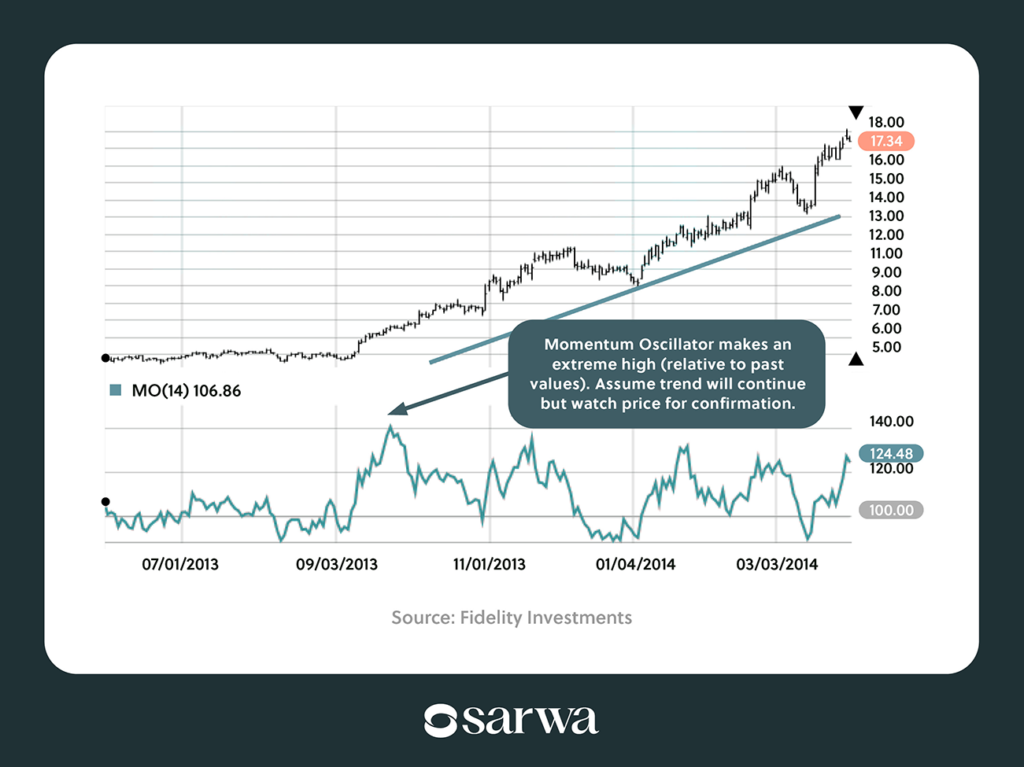
Momentum oscillator is one of the top technical indicators for day trading. It’s also an oscillator and it measures how much the price of a stock has changed over a given period.
The momentum oscillator is calculated as the current price divided by the previous price multiplied by 100.
Source: Fidelity Investments
As seen in the chart above, the momentum oscillator can go below 100 or above it.
Unlike other indicators, the momentum oscillator does not have an upper or lower boundary. Each trader will have to study past data and identify a support and resistance level that constitutes the upper and lower boundaries.
How to use the momentum oscillator
- Identifying trend continuation: When the oscillator is above the upper boundary in an uptrend, it indicates that the current uptrend is likely to continue. On the other hand, if it crosses below the lower boundary in a downtrend, it indicates that the downtrend may continue.
- Price reversal: As with RSI and MACD, a divergence between the momentum oscillator and the price chart can indicate that a price reversal is about to happen.
On-balance volume (OBV)
OBV, like the momentum oscillator, measures the likelihood that a trend will continue or not. However, unlike the momentum oscillator, it is a volume indicator – it uses trading volume data to forecast trend continuation.
The on-balance volume is the cumulative difference between trading volume on days when prices are rising and on days when prices are falling. OBV will increase when today’s closing price is higher than yesterday’s and decrease when it is the other way around.
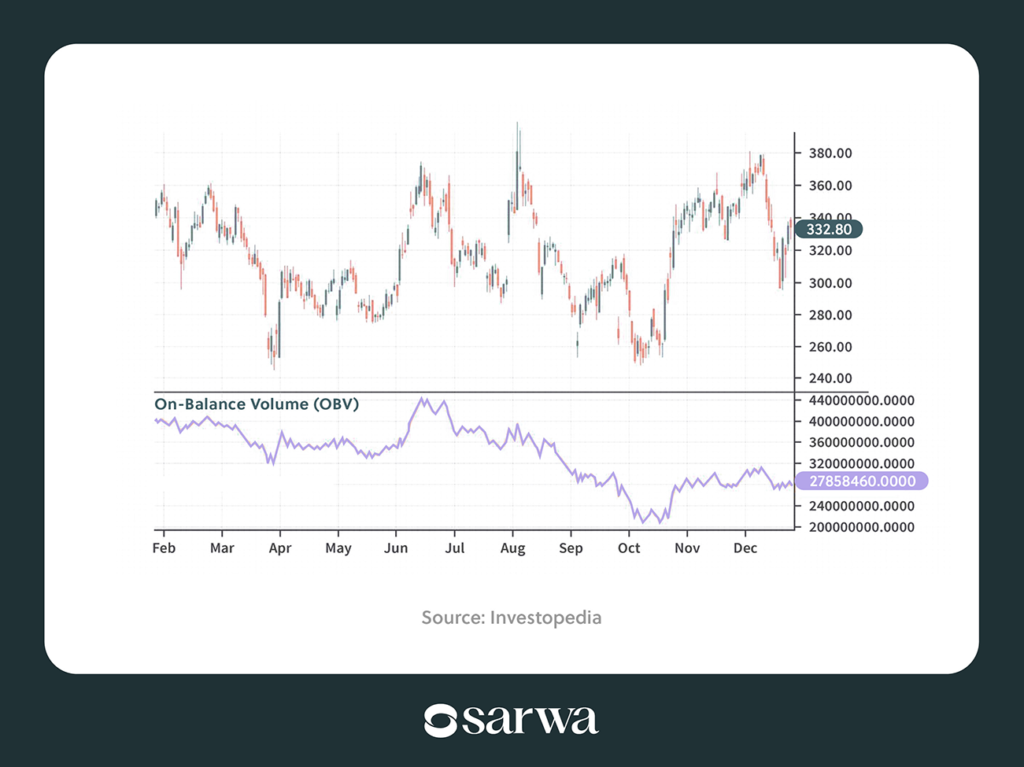
Source: Investopedia
How to use on-balance volume
- Determining trend continuation: When OBV is making higher highs and higher lows, it indicates that an upward trend is likely to continue. If the OBV is making lower lows and lower highs, then the downward trend is likely to persist.
- Price reversal: If the trendline on the on-balance volume is diverging from the price chart, then a price reversal might be underway.
[Other worthy mentions include stochastic oscillator and accumulation/distribution line (A/D line)]
How to use technical indicators: Tips for day traders
As we have mentioned, technical indicators are best used together and not in isolation. If the momentum oscillator is showing that the trend will continue, you also need to see whether the on-balance volume agrees. Trading opportunities identified based on one indicator are risky.
Second, instead of asking which technical analysis is best, use them all. Combine candlestick patterns, moving averages, Fibonacci retracement, and technical market indicators to perform a comprehensive technical analysis.
Third, you should develop a trading strategy (trend following, breakout trading, range trading, momentum trading, reversal trading, value chart indicator strategy, etc.). A trading strategy will give you trading signals – what needs to happen before you enter and exit a trade (via take profit or stop loss). This is where you will put all these top technical indicators for day trading into use.
A trading strategy is a guideline and it prevents trading from being the equivalent of the roll of a dice. Unlike others, you are making trading decisions based on a well-developed plan or checklist rather than doing just what everyone else is doing.
Fourth, as a day trader, focus on short timeframes (30 minutes, 1 hour, 4 hours). When you use the appropriate time frame on your price charts, then you will get more valuable information from your indicators.
Finally, update your trading strategy when necessary. A trading strategy aims to consistently make more net profits (after commissions) than losses. In other words, the goal is to have a high win ratio.
If your trading strategy is not giving you the win ratio you find comfortable, then you may need to tweak it to improve performance.
4. How to start day trading stocks in the UAE
Day traders across the globe have always favoured the US stock market because it is the largest (market cap), most liquid (transaction volume), and most diversified. Therefore, it provides the biggest opportunities to make consistent profits.
If you are in the UAE, you can trade US stocks right from here using the Sarwa Trade app. You will gain access to thousands of stocks and ETFs in various US stock exchanges.
Why should you sign up with Sarwa Trade?
- Safety: Sarwa is regulated by the ADGM Financial Service Regulatory Authority and it adheres to the highest compliance standards. Also, we secure your data and money with bank-level 256-bit encryption. You will never need to worry about losing your hard-earned money.
- Fractional trading: If you don’t have a large capital for trading and you cannot afford to buy a whole share, you can buy and sell a fraction of a share while you accumulate more capital.
- Low cost: We charge the higher of $1 and 0.25% of the value of your purchase or sale, which is lower than the average brokerage fees charged by stock brokers. With us, you can trade frequently without eating deep into your profits.
- Start with just $1: We don’t require you to have $1,000 before you can start. If you have just $1, you can start your trading journey on Sarwa Trade.
- Zero international transfer fees: We don’t charge you anything for transferring money to your trading account from your UAE bank account or your trading account back to your bank account.
- Instant deposits: As a day trader, opportunities are always presenting themselves and you can’t delay. At Sarwa, we ensure your deposits are completed immediately.
- Simple and intuitive platform: Our platform provides you with charts and market news that will aid your trading. Furthermore, Sarwa Trade is easy to use (with a nice interface) and you can navigate it with little to no guidance.
[Are you ready to make daily profits trading US stocks from the UAE? Sign up for Sarwa for secure, low-cost, and seamless stock trading.]
Takeaways
- Trading is all about using past and present data to make accurate forecasts of future prices.
- Technical indicators are very key to the process of making accurate forecasts of future price movements. Lots of them are available on technical analysis trading software.
- Whether overlays or oscillators, the best technical indicators can help to identify trends, measure the strength of a trend, and predict current trend continuation, among others.
- Day traders must use technical indicators as part of the building blocks for a solid trading strategy.