
If you have ever had doubts about the possibility of making money trading stocks, perhaps the recent case of NVIDIA, the technology firm, should make you reconsider. Anyone who bought $1,000 worth of NVIDIA on January 2, 2024, and sold at the end of June 14, 2024, would have $2,738, a whopping 173.78% return on investment.
However, though it is easier to make one or two good trades and profit from it, the really difficult task is how to make money trading stocks consistently.
Academic studies in Brazil, Taiwan, and the United States and an analysis of trading data on eToro, a trading platform, by CuriousGNU, a data analytics website, have all concluded that only a very small percentage of day traders make a profit (net of commission) consistently over the years.
No wonder, then, that 93% of day traders quit within the first two years, according to The Street, an investment education website.
What then does it take to be among the few who succeed and remain when the breeze of the market has blown the majority away?
Serious stock traders will need a wide range of economic knowledge, investment strategies, and emotional intelligence to make money in the stock trading world. Let’s face it: In the stock market, even just knowing the basics won’t always cut it.
Ray Dalio, a brilliant investor and hedge fund manager, once said: “If you are ready to give up everything else and study the whole history and background of the market and all principal companies whose stocks are on the board as carefully as a medical student studies anatomy; if you can do all that and, in addition, you have the cool nerves of a gambler, the 6th sense of a clairvoyant and the courage of a lion, you have a ghost of a chance.”
Sarwa wants to set you on that path by providing you with the knowledge you need to become a better trader and improve your chances of being among the minority who can consistently make money trading stocks.
In this article, we take you on a deep dive into certain strategies to implement in your stock trading journey. We’ll consider:
- What is stock trading?
- Types of stock trading
- How to make money trading stocks in 7 steps
- Where to start stock trading
[Are you ready to make money trading US stocks in the UAE? Sign up for Sarwa Trade for secure, low-commission, and zero-transfer-fees stock trading.]
1. What is stock trading?
Simply stated, stock trading is the buying and selling of the stocks of companies. This buying and selling can occur on a stock exchange or an OTC (over-the-counter) market.
A stock is a portion of a company’s ownership made available to individual and institutional investors. When you purchase a stock, you have a stake in the company’s equity corresponding to the number of shares you own.
[To learn more about stocks, read, “What Is A Stock? An Investor’s Guide” and for more about how stock exchanges work, read, “What Is A Stock Exchange?]
To understand stock trading, it’s important to differentiate it from stock investing (also called long-term investing). While the stock investor is looking to profit from buying and holding a stock for a long period (and only earning dividends in the short term), a stock trader wants to profit more frequently from the short-term fluctuations of the stock.
Said differently, a stock investor waits for the company to grow its price through constant and consistent earnings (and profit from the compounding effect) while the stock trader is more concerned about the short-term demand-and-supply-driven fluctuations in price.
2. Types of stock trading
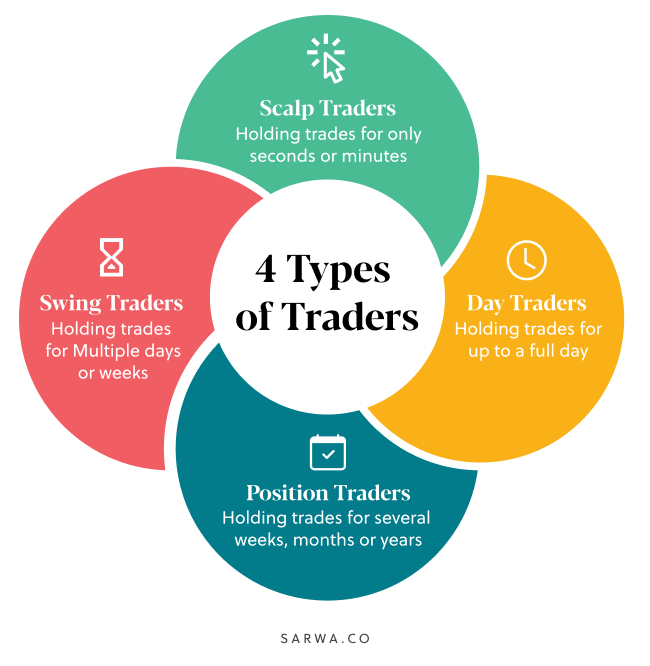
Though all stock trading, contra stock investing, involves taking small and frequent profits, we can also differentiate between different types of stock trading.
Day trading
Day trading is a form of stock trading where traders open and close a position within a trading day.
Opening a position can mean either going long on a stock (buying a stock with the expectation of selling for a higher price) or going short (borrowing a stock from the broker and then selling it with the hope that the price will fall so you can buy it cheaper later and return it to the broker).
In short (no pun intended): closing a long position means selling the stock you bought and closing a short position means purchasing a stock so you can return it to the broker.
Can you make a lot of money day trading? Yes, you can. However, as we have seen, making that money consistently requires certain strategies that we will cover in the next section.
Swing trading
Swing traders stay in a position for more than a day. They enter into a position, then set a target price where they expect to take profit and another target price where they expect to cut short their losses if the trade goes against them (stop loss). It may take days or even weeks before the stock hits either the target price or the stop loss.
Learning how to swing trade stocks is often a better option for those who can’t spend hours everyday day analysing and making trades.
Position trading
Position traders are trend traders. There are two types of trends in stock trading — upward and downward trends. An upward trend occurs when the price of a stock is rising (the charts show higher highs and higher lows) and a downward trend occurs when the price is falling (the charts show lower highs and lower lows).
A position trader enters a long position at the beginning of an upward trend and a short position at the beginning of a downward trend. He then waits until the trend is about to change before closing his position.

In the chart above, a position trader will take a long position on July 13, for example, and only close the position somewhere between November 23 and 30 when a candlestick pattern shows that a reversal is imminent. Similarly, a position trader will take a short position anywhere between November 23 and 30 and wait till February 15 when the candlestick pattern shows that a reversal is imminent.
Scalping
Scalping involves quickly profiting from the bid-ask spreads that occur due to fluctuations in the supply and demand of a stock.
In this system, a trader can take many positions in a day and exit them within a few minutes or hours. The focus is on profiting from small movements in stock prices. By taking many positions, the small movements in price can add up and become significant.
Scalping is for those who want to learn how to trade stocks and make money fast. However, it often requires investing a lot of time sitting before the computer or phone screen.
Deciding between these four types of stock trading will depend on your trading and personal finance goals.
Do you need to make money daily, or do you prefer to wait for days and weeks? Similarly, do you want small profits that add up (like in scalping) or do you prefer to wait for a trend to end and take a more significant profit at once (like in position trading)?
Your risk tolerance also matters. Scalping and day trading are riskier when compared to swing and position trading.
Source: Pinterest
3. How to make money trading stocks in 7 steps
Whichever stock trading type you choose, you still need to learn strategies on how to trade stocks so you can make money from them.
It’s important to say here that every stock trader, even the most experienced ones, can lose money. What sets successful traders apart is that they make money more times than they lose it, and they can set up a win that brings in more money than a loss will take away.
Let’s begin!
A. Understand the stock market and go with what you know
Warren Buffet once said that “the most important investment you can make is in yourself.” And as we have seen above, Ray Dalio highlights the need to study the stock market like a medical student studies Anatomy.
Consequently, the first step to take if you want to know how to make money trading is to better understand the stock market. You can’t rely on “luck” or just do what some “guru” on Twitter or YouTube suggests.
Aside from reading Sarwa’s blog, you can follow our Book Club and read the books we are reading.
Furthermore, in addition to reading as many books as you can get your hands on about the stock market, you also need to gain knowledge and inspiration from the success stories of successful investors and traders.
Additionally, and especially for our purpose, Buffett has also said, “Never invest in a business you cannot understand.” So, you should understand exactly what the business model and industry you are investing in, as well as how much you understand about how the overall stock market functions.
Another way to go about it is to start with what you know best. Literally. People buy certain stocks because they believe in the industry or the company, and that they have a better understanding of what they are trying to do. Ask yourself which industries you know most about.
B. Try: Build confidence with demo and fractional trading
To help stock traders perfect their strategies and reduce the risk of losing their money, some platforms allow you to trade with virtual money, a process called demo trading.
Before learning how to trade stocks with real money, you can start with a demo account. Use demo trading to perfect your strategy — identify the reasons you lose money and come up with a plan to stop them.
One way to reduce your risk while perfecting your strategy is to invest a small amount through fractional trading.
With fractional trading, you can buy a fraction of the share of a company. If the share of a stock is $100, this means you can buy 1/10th of a share for just $10. So, instead of working with a demo account, you can get your feet wet in the real market with just a small amount of money.
C. Fundamental analysis: A brief guide for what to look for when picking quality stocks
There is a continuing argument among stock traders on the relevance of fundamental analysis. On one side are those who believe that technical analysis is all that’s important for success and on the other hand are those who use both.
Fundamental analysis is important to traders for two reasons, according to Investopedia.
First, it can help them understand the “overall state of the market.” Price charts may show that a stock will soon be in an uptrend, however, fundamental analysis may show that a recession is imminent (or that the company has failed to meet earnings estimates). Consequently, the uptrend may not materialise.
Second, fundamental analysis can help traders obtain information about the “attractiveness of a specific security as compared to other securities.”
In regards to attractiveness, stock traders look for at least three things in a stock:
- Liquidity: Since traders want to enter and exit a trade quickly, the stocks they select must be very liquid. Having to wait for hours or even days before orders can be filled can result in price changes that may turn a profitable trade into a losing trade.
- Volatility: Traders want stocks whose prices can significantly go up and down in an uptrend or downtrend. Stocks that spend too much time in a range are not as desirable as those with clear trends.
- Trading volume: Liquid stocks will often have high trading volume. With many buyers and sellers trading the stock, liquidity will not be an issue. Stocks with high trading volume will also have volatile prices, providing opportunities to make money through a long or short position.
Some traders will also consider additional fundamentals like:
- Earnings potential: Position traders who stay in a trade for months may consider the earning potential of the stocks they purchase since longer-term trends in prices are driven by earnings.
- Stability: Some traders also prefer to stay away from companies at the risk of liquidity and solvency problems. Consequently, they will be concerned with financial ratios like the current ratio (current assets to current liabilities) and the debt-to-equity ratio.
Some words on sentiment analysis
Another analysis that has grown in importance, including in the cryptocurrency and Forex market, is sentiment analysis. It is similar to the first part of fundamental analysis since it is also concerned with the overall state of the market.
However, instead of macroeconomic (GDP, interest rate, inflation rates) or industry-specific information (supply shocks, role of automation), it focuses on the sentiments of market participants. This analysis crunches various market data to determine where market psychology currently stands.
At any time, market sentiment can be bullish, bearish, or neutral. Also, market participants can be fearful or greedy.
Some of the most popular indicators in sentiment analysis are:
- Volatility index: Also called the fear index, it uses options prices to determine the implied volatility in the market. Higher implied volatility will mean that market participants are fearful that the ongoing trend will not continue.
- High/low sentiment ratio: This shows the number of stocks making their 52-day highs and lows. If more stocks are making this high, the market is bullish, and vice versa.
- Fear and Greed Index: This considers various share price, volume, momentum, and volatility indicators to show whether fear or greed is dominating the stock market.
- NYSE bullish percentage: It shows the percentage of companies in the NYSE that are bullish at a point in time. When this number is extremely high, it might indicate an overbought situation, and vice versa. Bullish indices also exist for NASDAQ and the S&P 500.
- Buffett indicator: This shows the ratio of the value of the stock market (total market cap) to the GDP of the economy. When this is very high, it might indicate that a bubble has developed.
- Social media: There are now many investor communities on social media. Gauging the sentiments of these communities is another way to approximate market sentiment.
D. Technical analysis: Learn how to read stock trading charts
Now, this section might be a bit long. Bear with us. It’s good to understand some of these stock trading concepts. You will then have a better understanding of what research shows works best when it comes to chart reading.
Learning how to trade stocks does not stop at picking the right ones. While fundamental analysis tells you which stocks to buy, technical analysis tells you when to buy them.
For long positions, stock traders buy when the price is low and wait for the price to rise to make a profit. On the other hand, for short positions, stock traders sell when the price is high and wait for the price to fall to buy back.
To find the right time to enter, you will need to do a technical analysis. There are three basic elements of technical analysis:
Charts and candlesticks
Charts are visual representations of the price movements of a stock over a defined period.
You can set up a chart that represents price movements for the past day, week, month, quarter, etc. Day traders and scalpers focus on the daily chart, swing traders focus more on daily and weekly charts, and position traders look at the weekly and monthly charts.
The two major types of charts are line charts and candlesticks.
The former is a visual representation of the close price of the stock for a defined period. All the close prices for that period are visualised through a line that connects all the price points.
A price point can represent the close price after a 1-min, 5-min, 15-min, 30-min, 1-hour, 5-hour, or 1-day interval. Day traders and scalpers focus more on shorter intervals (1-min, 5-min, 30-min, 1-hour) while swing traders and position traders tend to focus more on longer intervals (5-hour, 1 day).
Sample Line Chart of Amazon’s Stock From June 2023 to June 2024

Source: Trading View
While line charts are good at showing the trend of a stock price over a period, candlestick patterns contain more information which will help you identify current trends and predict future ones.
A candlestick chart represents the prices (opening price, closing price, highest price, and lowest price) of stocks as candlesticks. The body of the candlestick depicts the opening and closing price while the wick of the candle represents the highest and lowest price.
There are two types of candles: green candles and red candles.
For a green candle, the stock closed at a price higher than the opening price, which means the upper part of the body is the closing price and the lower part is the opening price. On the other hand, for a red candle, the stock closed at a price lower than the opening price, which means the upper part of the body is the opening price and the lower part is the closing price.
Sample Candlestick

Source: Warrior Trading
What then is the use of candlesticks?
First, candlesticks, like line charts, can show how a stock is trending. If the candlesticks are showing higher highs (the highest price of the current candlestick is higher than the highest price of the previous) and higher lows (the lowest price of a current candlestick is higher than the lowest price of the previous), the stock is in an uptrend. If, on the other hand, there are lower highs and lower lows, the stock is in a downtrend.
Uptrend and downtrend on a candlestick chart
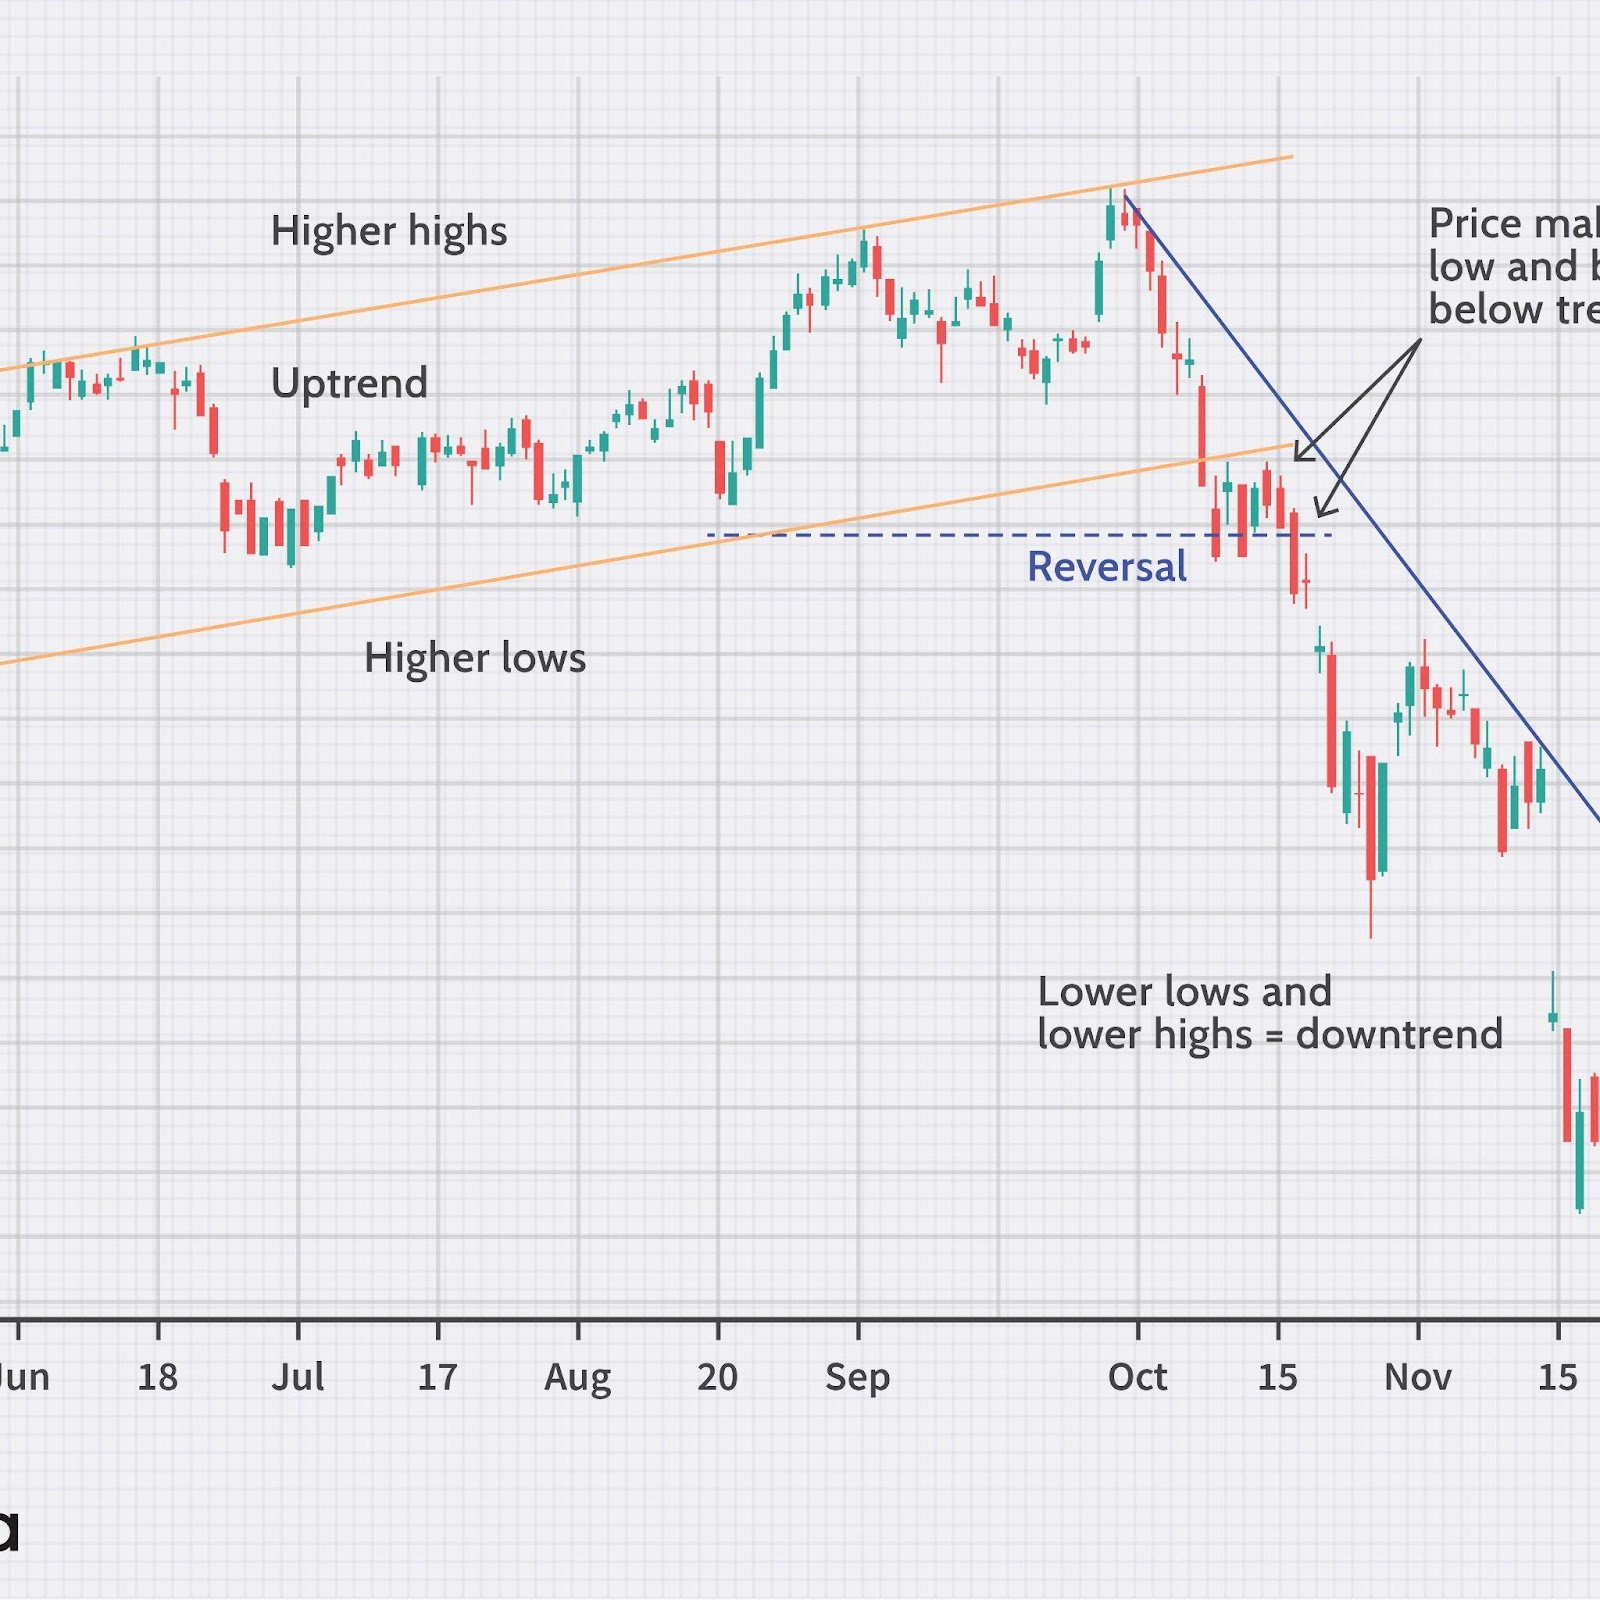
Source: Investopedia
The trend of the stock will determine if you will go long (in an uptrend) or short (in a downtrend).
Second, candlesticks can help you predict future trends. Over time, traders have identified certain candlestick patterns that show when a trend will continue or when there will be a reversal (a downtrend is about to become an uptrend, and vice versa).
Moving averages
A moving average shows the mean price of a stock over a defined period. Moving averages are plotted as a sort of line chart overlapping the candlesticks.

Source: IG Charts
In the above chart, the black, red, and light-green lines across the candlesticks are moving averages.
There are two types of moving averages: simple and exponential.
A simple moving average takes the average of all stock prices within a specific period without regard for the most recent prices. On the contrary, an exponential moving average puts more weight on the most recent prices. The most popular simple moving averages are the 50-MA (50 days moving average), 150-MA (150 days moving average), and 200-MA (200 days moving average). For the extended moving averages, the common ones are the 9-EMA and 12-EMA.
But how do moving averages help you trade?
They can also help you to identify or clarify trends. When a higher moving average (e.g. the 150 MA or the 12 EMA) is above a lower moving average (e.g. the 50 MA or 9 EMA), there is a downtrend, and vice versa.
Indicators
While indicators also show trends, they are primarily used to determine if a stock is being overbought or oversold. When a stock is being overbought, its capacity for a further price increase is minimal. And when it is being oversold, its capacity for a further price decrease is minimal.
While there are many technical indicators on various chart platforms, the most common ones include:
- Relative Strength Indicator (RSI): The RSI ranges from 0 to 100. Figures above 70 are indicators of an overbought situation while figures below 30 are indicators of an oversold situation.

Source: IG Charts
- Stochastic Oscillator: The stochastic oscillator, like the RSI, also ranges from 0 to 100. Here, figures above 80 show that the market is overbought while figures below 20 show that it’s oversold.

Source: IG Charts
- Bollinger Bands: They show the volatility of a stock over a defined period. When the bollinger bands are too far from each other, it represents high volatility. When prices are above the upper line of the bollinger band, traders interpret it as an overbought condition and when prices are below the lower line, traders construe it as an oversold condition.
The two red lines in the chart below are bollinger bands.

Source: IG Charts
- Moving Average Convergence Divergence (MACD): MACD shows the changes in the momentum of a stock by comparing two moving averages (simple or exponential). Convergence shows that two moving averages are coming together, hence a decreasing momentum, while divergence shows they are growing apart, hence an increasing momentum.

Source: IG Charts
Indicators should not be used in isolation. They should be combined with candlestick patterns and moving averages before a trading decision is made.
Also, it is better to use multiple indicators before making any conclusion about the direction and strength of a trend. Nevertheless, using too many indicators is not appropriate. Focus on a few of them that work well with your strategy.
E. Create and stick to your strategy: The waiting game
A big part of learning how to make money online trading depends on creating a solid strategy.
Your stock trading strategy will determine how you decide to enter into a trade. For example, which candlestick patterns will you use to predict future trends, which moving averages will you use to identify trends, what relationship must the moving average have with the candlesticks to indicate a good entry point, which indicators will show if the stock is overbought or oversold, how do you determine support and resistance, and how do they impact your decision?
A good trading strategy will have specific and comprehensive criteria for entering a trade.
Moreover, a good trader will always stick to their strategy. “Never, ever argue with your trading system,” said Michael Covel, an author and entrepreneur, in his book, The Little Book of Trading. “Top traders … have found, through hard work, diligent study, and perhaps a little luck” he also said, “that their ability to stick with a trading plan is far more important than knowing or worrying about what their neighbour is doing.”
If all your criteria don’t fall into place, then don’t take the trade. Taking a trade due to the pressure of other people commending the trade is risky. As Warren Buffet said, “The most important quality for an investor is temperament, not intellect.” So learning to keep your emotions in check and to go with the strategy you have chosen can be among the most important assets you have.
“There is a time to go long, a time to go short, and a time to go fishing,” said Jesse Livermore, the pioneer of day trading. In other words, you don’t have to place a stock trade when your strategy tells you not to.
“If most traders would learn to sit on their hands 50 per cent of the time, they would make a lot more money,” according to Bill Lipschutz, director of portfolio management at Hathersage Capital.
Of course, you can change a strategy if it’s no longer working for you. However, changing a strategy is different from ignoring a strategy to take a risky trade. If you need to change a strategy then you should stop trading, rework the strategy, and then resume trading with the new strategy. When the new strategy is in place, you must also ensure you don’t take any trade unless your strategy gives you the go-ahead.
F. Diversify your capital: Buy many quality stocks
Can you lose money in stocks even when you have a sound strategy?
Of course, the answer is a resounding yes. Asset classes with high returns also have high risk, as any investment advisor will tell you.
Even the best strategies are not flawless. Is the stock market worth it, then?
Yes, it is. As said above, the important thing is to win more times than you lose and for a win to bring in more money than a loss will take away.
A good way to do this is to reduce your risk through diversification. Diversification, in essence, is a strategy that dictates that you should not put all your eggs in one basket. Instead of buying a single stock or two stocks, you should trade many quality stocks to reduce your overall risk.
You can even trade ETFs (exchange-traded funds) or index funds (which are baskets of tens, hundreds, and thousands of stocks) instead of individual stocks to achieve broad diversification even on single trades.
For investors, this means buying stocks that are negatively correlated; however, for traders, it means implementing a good risk management system.
Ray Dalio, goes by three general rules:
- “Diversifying well is the most important thing you need to do in order to invest well.”
- “Don’t make the mistake of thinking those things that have gone up are better, rather than more expensive.” (A nice reminder that past performance is no guarantee of future results.)
- “Do the opposite of what your instincts are.” (Or put in another way: Buy when others are fearful, sell when everyone is greedy.)
Risk management helps to reduce the amount you can lose when you take a losing trade by ensuring you only invest a small portion of your capital in any particular stock.
For example, if your trading capital is AED 10,000, you can’t put a significant part of that in just one trade. Instead, maybe only 1% to 5% of your capital will go into any single stock; indeed, a common guideline from investment professionals is to not invest more than 5% into any one stock.
So, for Stock A, no matter how confident you are in the trade, you are only putting between AED 100 and AED 500. This helps you diversify your risk into various stocks such that one loss will not significantly burn your capital.
“I have two basic rules about winning in trading as well as in life,” said Larry Hite, founder of Hite Capital Management, a hedge fund. “One. If you don’t bet, you can’t win. 2. If you lose all your chips, you can’t bet.” Never lose all your chips. As Marty Schwartz, author of Pit Bull: Lessons from Wall Street’s Champion Day Trader, puts it, “The most important thing in making money is not letting your losses get out of hand.” Diversify, diversify, and diversify.
Also, you need to ensure that when you take a trade, what you will gain from winning is higher than what you will lose if you fail. For example, if you trade with AED 100, you must ensure that what you will gain is at least 1.1X what you will lose if the trade fails.
Similarly, ensure that you never lose all your money in a losing trade by setting a stop loss. A stop loss is a target price which signifies that you should exit a trade to avoid further losses. Your trading strategy must include how you determine your stop losses.
Therefore, the maximum amount you can lose is the difference between the price you entered and your stop loss target price. So, the amount of profit you expect to make must be at least 1.1X that possible loss.
G. Measure your performance
“What gets measured gets managed,” said Peter Drucker, the father of modern management. Learning how to make money trading stocks thus requires you to keep a tab on every trade you take and how it turns out.
Remember that the way you make money in stock trading is to ensure that your wins outweigh your losses. To know that, you must keep updated records of your performance.
Once you can measure, then you can manage. A way to manage is to perfect your trading strategy. Why are you making losses? How can you avoid or minimise those losses? What needs to change in your strategy for better results?
A good thing to do is to learn from other more successful stock traders. Nevertheless, avoid being a clone. Learn from their strategy and use the good points you find to perfect yours instead of swallowing it hook, line, and sinker.
- Where to start stock trading
Once you have a strategy in place, you can now move on to how to begin trading stocks by opening a brokerage account with the right trading platform.
There are many trading platforms available, some local and some international; therefore, you need to ensure you are choosing one with the best offerings for you.
Below are some of the most important factors to consider when choosing a trading platform:
Low minimum capital requirements
Some trading platforms will require that you have a significant amount in your account before you can start trading.
However, if you are learning how to start trading stocks as a beginner, then you might not yet have the confidence to start with a large amount. Also, even if you have confidence, your capital might not be up to the required minimum.
Hence, it’s better to go for platforms that have low minimum capital requirements that are favourable for retail or individual investors.
Fractional trading
Another factor especially important, if you are learning how to start trading stocks as a beginner, is that the platform allows you to do fractional trading. Fractional trading allows you to buy a fraction of a share of a company. So if you are interested in Apple (AAPL) but don’t have $144 to buy a full share of the company, you can buy 1/10 of the stock for $14.
Fractional trading is also important for risk management or diversification purposes. By purchasing fractions of many stocks instead of a single share of one expensive stock, you can diversify and reduce your risk.
Dashboard/platform
A good trading platform will provide you with a well-designed platform or dashboard where you can monitor all of your trades and evaluate your portfolio in one place. The platform should also provide you with real-time market news and stock data that can help you trade.
Data security
More important in cyberspace is the presence of good bank-level SSL security to protect your data and capital. If the platform is not forthright about the protection they provide, call or email them to ask. Don’t trade on any platform where you are not sure of your safety.
Regulatory compliance
A good trading platform will not violate any regulatory standards guiding the financial industry.
Customer support
Access to good customer support is also essential. A good trading platform will provide multiple options including phone calls, emails, social media, live chats, etc. Also, ensure the customer support staff are respectable and friendly.
Low commission/fees
Look for platforms with low trading fees.
If you are in the UAE, you don’t need to look far. Sarwa Trade is a trading platform that provides these features, among others.
We have dependable customer support, a well-designed platform/dashboard, and bank-level SSL security. Furthermore, we fully comply with regulatory standards imposed by the Financial Services Regulatory Authority.
You can get started trading stocks on Sarwa Trade with just $1 and our commission (0.25% of traded value) is less than the brokerage industry average. The fractional trading we provide also makes us a desirable platform for retail investors.
Finally, transfers from your local bank account to your trading account (and vice versa) are free. We provide you access to global stock markets without additional international transfer fees.
[If you are ready to implement the trading strategy you have created above, register on Sarwa Trade and you can begin to enjoy amazing features designed to help you achieve your trading goals.]
Takeaways
- Stock traders focus on earning frequent short-term profits while investors focus on long-term profits.
- If you are looking for how to make money from shares, you can consider being a day trader, scalper, position trader, or swing trader, depending on your financial goals.
- To properly learn how to trade stocks and make money, you must understand the stock market, choose the right stocks, diversify, stick to your strategy, and measure your performance.
- Your success also depends on the trading platform you use. Use a broker with cheap commissions, bank-level SSL security, low minimum capital requirements, good customer support, well-designed dashboards, and a provision for fractional trading.