
The Relative Strength Index (RSI) can tell traders when momentum may be stretched. The Moving Average Convergence Divergence (MACD) indicator takes the analysis a step further by showing how momentum is changing and whether a trend may be gaining or losing strength.
That makes it one of the most widely used indicators for spotting potential shifts in market direction.
But MACD is rarely at its best when used on its own.
Traders often combine its signal-line crossovers and histogram readings with RSI (and other top technical indicators) to filter out weaker setups and look for stronger confirmation.
In this guide, we’ll break down what MACD measures, how to interpret its key signals, and how it can complement RSI when analyzing trades.
We’ll cover:
- What is the MACD indicator?
- How to read the MACD indicator?
- How to use the MACD indicator: Popular MACD trading strategies
- Using the MACD indicator with chart patterns and other indicators
- Tips for using the MACD indicator
Do you want to learn more about the global financial market and the trading opportunities it provides? Subscribe now to Sarwa’s Fully Invested newsletter for regular expert insights.
1. What is the MACD indicator?
The Moving Average Convergence Divergence (MACD) indicator is a popular momentum indicator or oscillator that helps traders identify trend strength, direction, and potential entry/exit points.
It was developed by Gerald Appel, an American trader and money manager, in the 1970s. He designed it to reveal the relationship between short-term and long-term price trends, and to measure momentum by how this relationship changes over time.
When used properly, it provides a dynamic view of how market sentiment is changing, which is a key part of technical analysis.
Below is a sample MACD indicator added to a price chart:
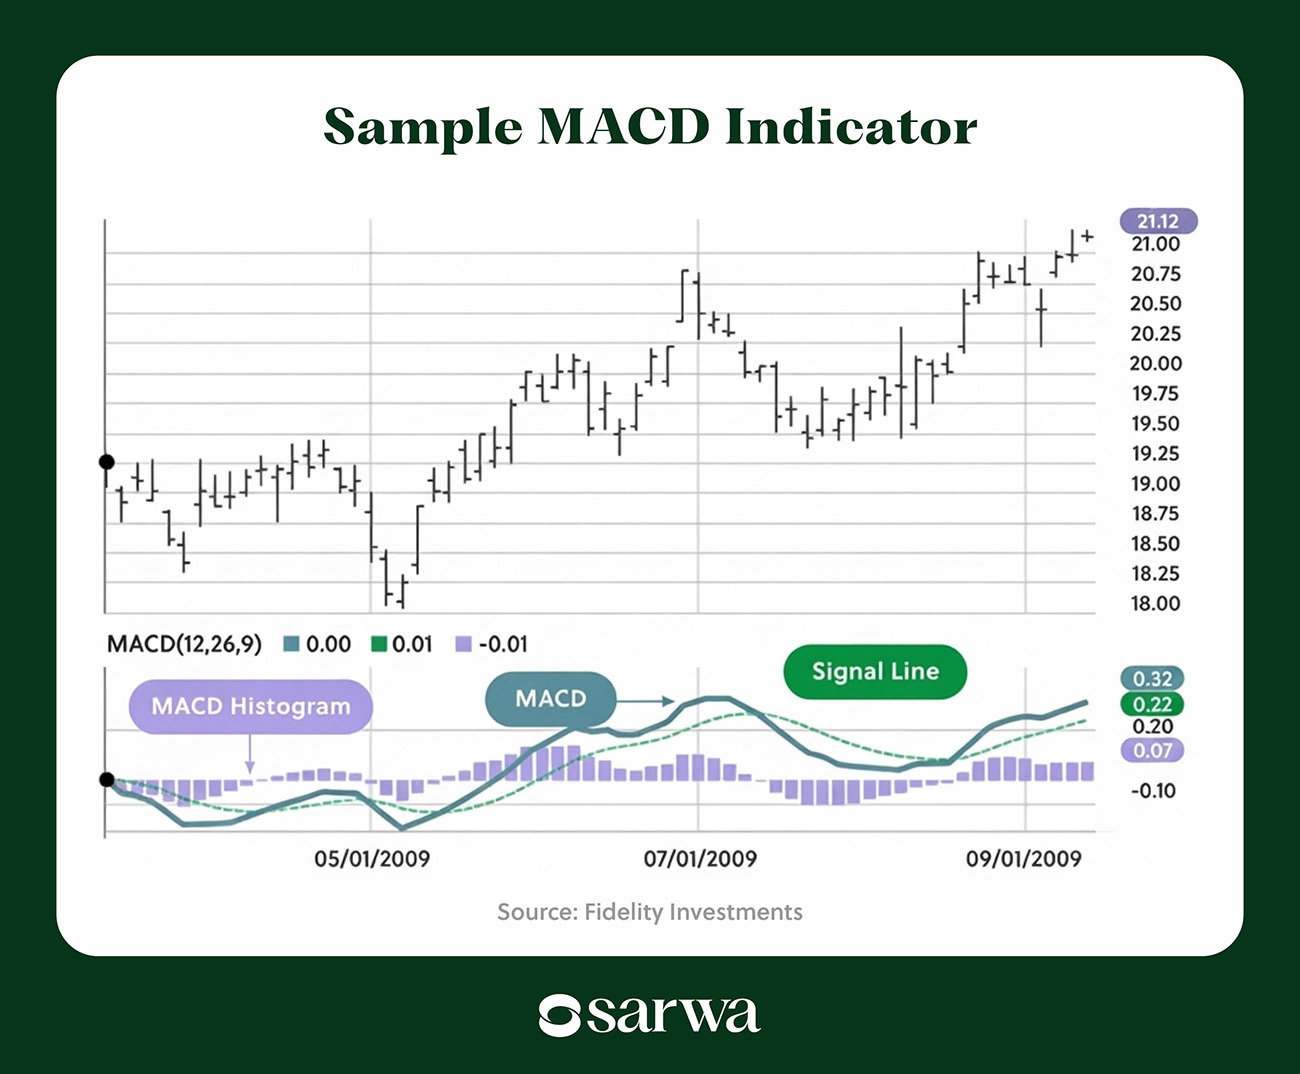
As seen above, there are four components of the MACD indicator:
- The MACD line: This line represents the difference between the 12-period and the 26-period exponential moving averages (EMA) based on closing prices. The 12-period EMA represents short-term momentum, while the 26-period EMA represents long-term momentum.
On a daily chart, the MACD line will represent the difference between the 12-day EMA and the 26-day EMA.
Unlike simple moving averages (SMAs), EMAs give greater weight to more recent prices, which makes them more useful in a momentum oscillator like the MACD.
When the MACD line is positive (above 0), short-term momentum is stronger than long-term momentum (12 EMA is greater than 26 EMA), and vice versa.
Because the MACD line is the difference between two EMAs, it shows how they converge or diverge over time. When the difference between them reduces, there is convergence, and there is divergence when it increases.
- The signal line: The signal line is the 9-period EMA of the MACD line. Since moving averages are designed to smooth trends and reduce outlier effects, the signal line can be seen as the smoothed version of the MACD line.
Many traders use it to measure trend strength.
- MACD histogram: The histogram is a chart that shows the distance between the MACD line and the signal line.
When the bars expand, it means the difference between the unsmoothed and smoothed version of the MACD line is increasing, which signals accelerating momentum. On the other hand, when they shrink, it signals that momentum may be fading.
- Zero line: The zero line is the baseline separating positive and negative momentum. When an asset operates above zero, we are in bullish territory, and vice versa. It is a marker of a trend shift, as buyers or sellers exchange domination.
Since it depends on moving averages, which are based on past price data, MACD is a lagging indicator. It confirms momentum shifts that are already underway.
2. How to read the MACD indicator?
As said above in the MACD definition, traders generally use the MACD indicator to identify trend strength, direction, and potential entry/exit points.
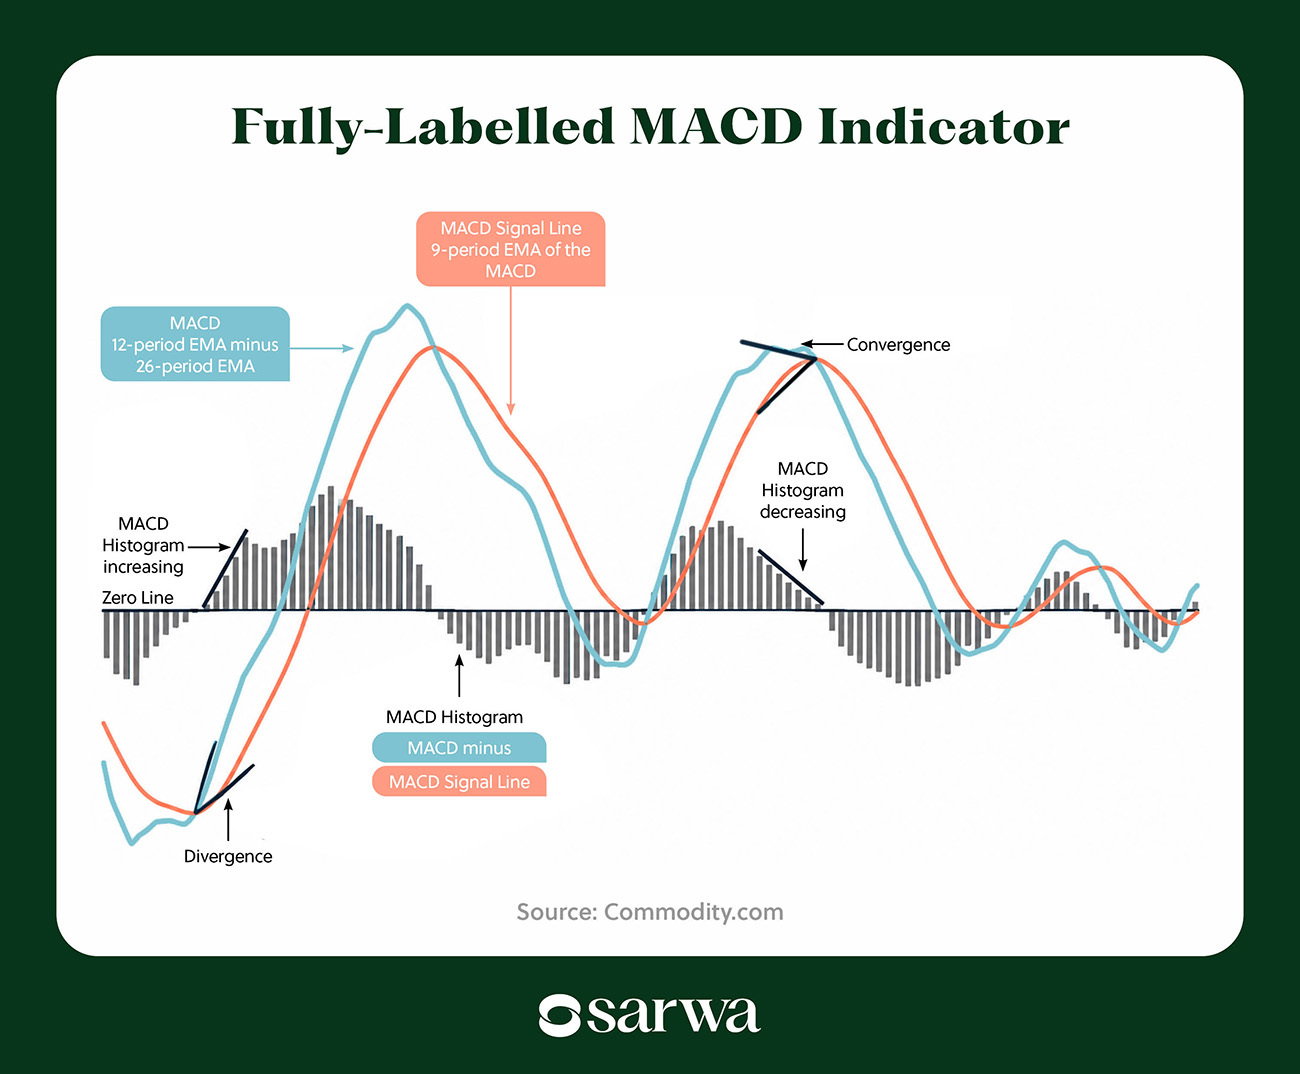
Now that we understand the different components, let’s consider how they serve these three purposes using the chart below as an example:
Source: Commodity.com
- Trend direction: When the MACD line (blue line) and the signal line (red line) are above the zero line (the black horizontal line), the market is bullish and short-term momentum exceeds long-term momentum.
On the other hand, both lines being below zero indicate that the market is bearish and long-term momentum exceeds short-term momentum.
- Trend or momentum strength: The size of the histogram is a measure of trend strength (irrespective of direction).
When the histogram bars are expanding, momentum is rising, and vice versa.
If the bars are positive (above the zero line), then this is an increase in bullish momentum. On the other hand, if the bars are negative (below the zero line), then bearish momentum is rising.
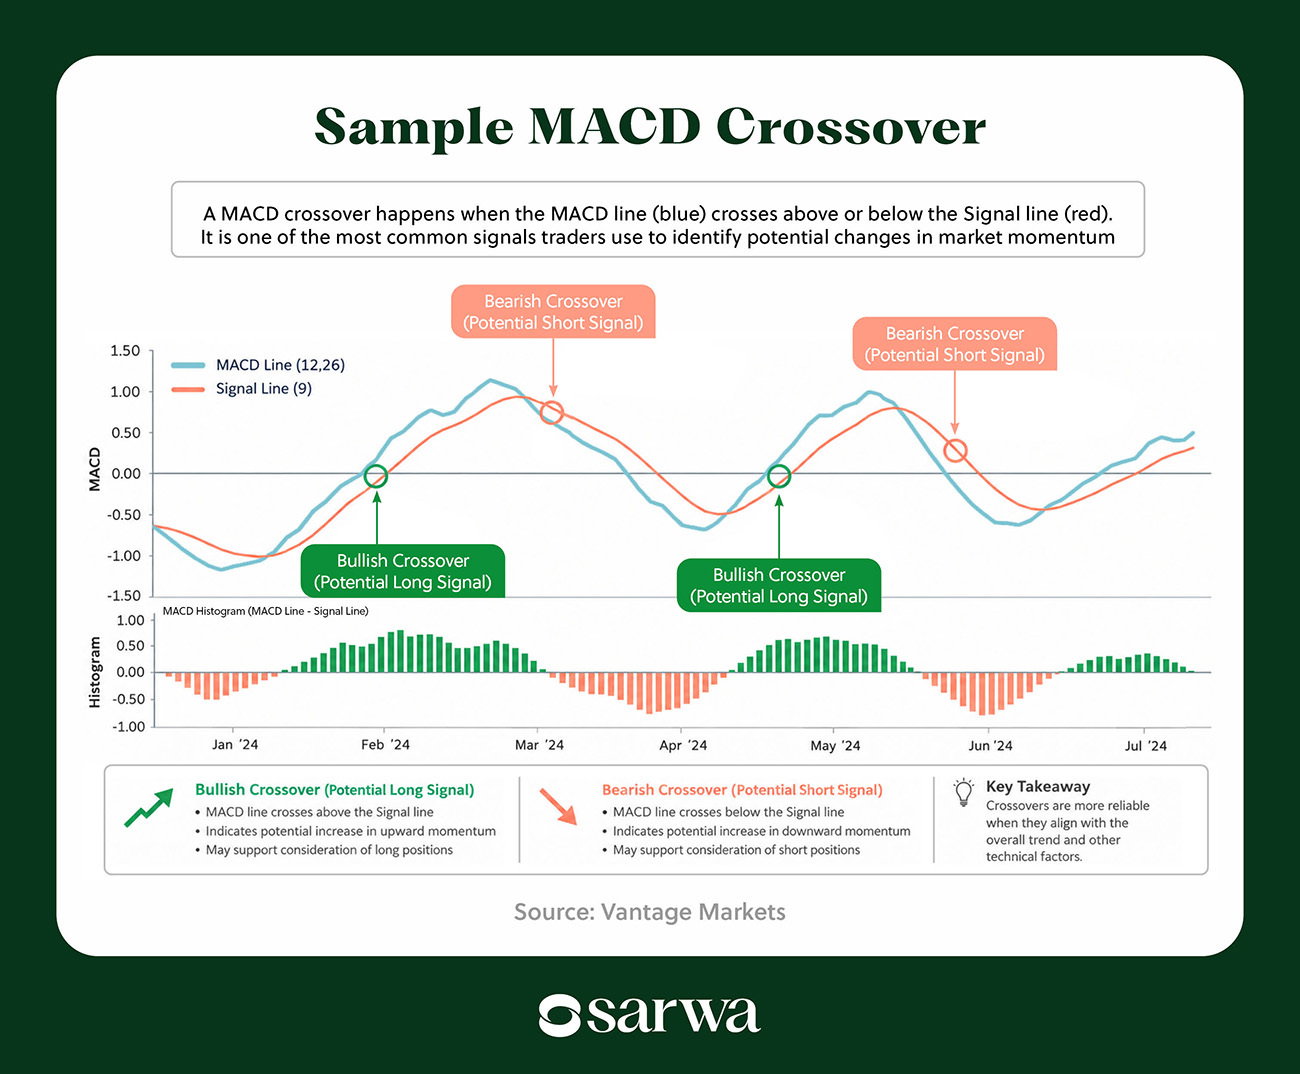
- Entry/exit points: The most popular entry and exit triggers are when the MACD and signal line cross one another.
The MACD line crossing above the signal line from below (bullish crossover) is commonly interpreted as a bullish or buy signal. On the other hand, the MACD line crossing below the signal line from above (bearish crossover) is seen as a bearish or sell signal.
Below is a chart showing the MACD crossover:
Source: Vantage Markets
3. How to use the MACD indicator: Popular MACD trading strategies
Traders have historically created trading strategies around the MACD indicator. We review some of the most popular ones below:
MACD crossover
We have already hinted at the MACD crossover strategy in learning how to read the MACD indicator.
To reiterate, traders watch for the MACD line to cross the signal line to identify potential buy or sell opportunities.
A bullish crossover occurs when the MACD line crosses above the signal line from below, while a bearish crossover occurs when it crosses below it from above.
As we will see below, experienced traders will look at price action for confirmation before entering a trade based on a MACD crossover.
MACD divergence
A MACD divergence occurs when the price chart reads differently from the MACD indicator. For example, the MACD indicator may show higher lows (bullish) while the price indicator shows lower lows (bearish).
There are two broad types of MACD divergences: bullish divergences and bearish divergences. This definition is based on what price is expected to do. So, a divergence is bullish when the expectation is that price will go up, while it is bearish when price is expected to fall.
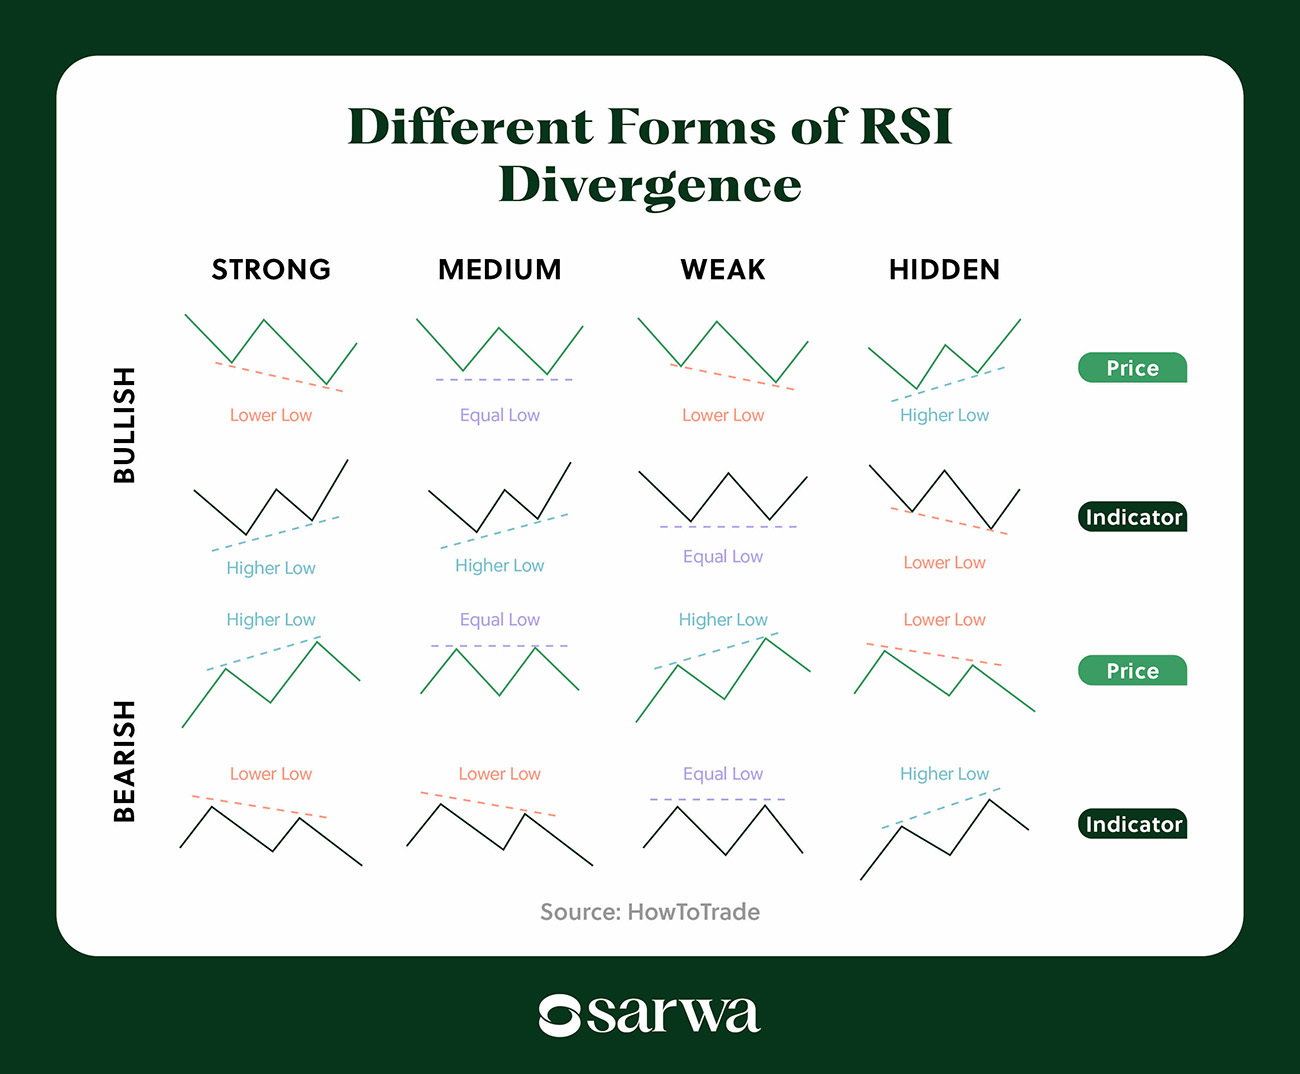
Divergences can also be strong, medium, weak, and hidden.
Below are the different types of MACD divergences:
Types of MACD Divergences
Source: HowToTrade
The major distinction is between strong/medium/weak divergences and hidden divergences.
For the former, when there is a divergence between the MACD indicator and the price chart, the price chart is expected to correct in the direction of the indicator.
For example, with a strong bullish MACD divergence, the MACD makes higher lows (bullish) while the price chart makes lower lows (bearish). The correction will occur in the direction of the MACD (bullish), which is why it is called a bullish divergence. In other words, strong/medium/weak divergences are price reversal signals.
On the other hand, hidden divergences are price continuation signals. In these cases, price continues the current trend even though the MACD indicator diverges from it. Take the bullish hidden divergence as an example. MACD is making lower lows (bearish) while price is making higher lows (bullish). However, price does not reverse to the MACD but instead continues on its upward momentum in contrast to the MACD.
MACD zero-line-cross strategy
The zero-line-cross strategy is a trend reversal technique.
When the MACD line crosses above the zero line, there is bullish momentum and the potential start of an uptrend. On the other hand, when it crosses below the zero line, there is bearish momentum and the possible start of a downtrend.
Below is an example of this strategy in action:
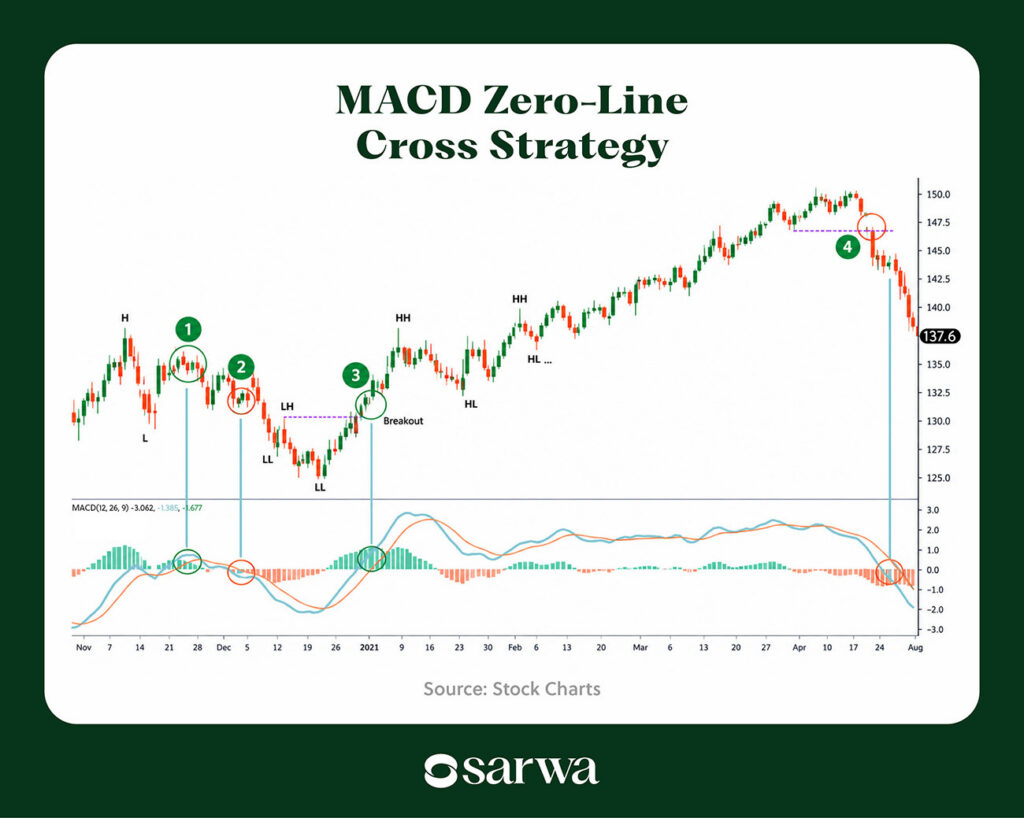
Source: Stock Charts
Experienced traders usually combine this strategy with price action for more confident trades. But more on that later.
MACD histogram reversals
This is a strategy that relies on spotting momentum shifts early, before they appear in the price chart or even the MACD crossover.
As said above, the MACD histogram is a momentum gauge, as it measures the difference between the MACD line and the signal line.
When the histogram shrinks after a period of expansion, it signals a momentum slowdown, which can be a prelude to a price reversal. Also, when it expands after a period of shrinking, momentum is increasing, and price should continue the current trend.
The chart below shows how this works:
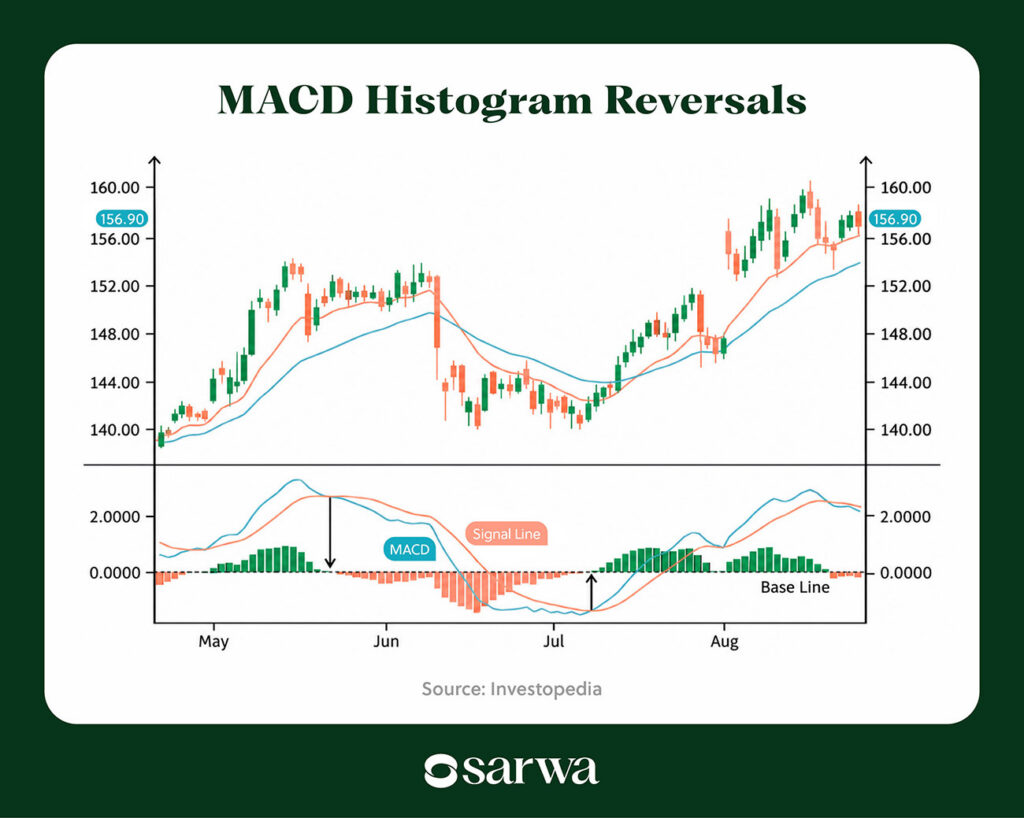
Source: Investopedia
In the first set of green bars, there is an expansion that begins around the 6th bar. Since we are in an uptrend (above the zero line), this indicates price continuation to the upside, which is the exact thing that happened.
Consider the set of red bars that came after this. An expansion started around the 13th bar, which leads us to expect price continuation to the downside. And this happened over the next few days.
Notice also that after a while (around the middle of June), the red bars began to shrink. What followed? A reversal to the upside.
4. Using the MACD indicator with chart patterns and other indicators
Experienced traders don’t place the burden of their trade decisions on a single lagging indicator, even if it’s a useful and popular one like the MACD indicator.
Instead, they combine the indicator with other indicators (Bollinger Bands, RSI, OBV, etc.), candlestick chart patterns, price chart patterns, and other price action data (volume, support and resistance, trendlines, etc.).
“I wouldn’t take a trade based solely on the MACD,” said Deepak Shukla, the CEO of Pearl Lemon Finance, a platform matching businesses to lenders. “It works better as part of a bigger setup. I’ll look at support and resistance, price action, and the wider trend alongside it. RSI can add some useful context as well. If the chart doesn’t support what MACD is showing, I’m usually not interested in the trade.”

Let’s see examples of how this bigger setup works.
How to use MACD and RSI
The RSI indicator is also an oscillator, and it measures the relative strength of positive and negative price movements.
Many traders use it to identify when an asset (stocks, cryptocurrencies, forex, commodities, ETFs, etc) is overbought or oversold. Some also use it to identify trend direction and strength, which are also popular uses of the MACD indicator.
There are two ways to combine the MACD and RSI:
- MACD crossover as an entry/exit point in oversold or overbought conditions: The RSI crossing above 70 is seen as evidence that an asset is overbought. On the other hand, the asset is said to be oversold when the RSI crosses below 30.
New traders tend to take trades when an asset enters overbought (sell) and oversold (buy) territory. However, in trending markets (when the market trend is strong), an asset can remain in overbought or oversold conditions for a long time without any price reversal happening immediately.
Consequently, experienced traders want to confirm if a price reversal is imminent by looking at the MACD indicator.
Basically, they want to see a bullish crossover in oversold territory and a bearish crossover in overbought territory.
Below is an example:
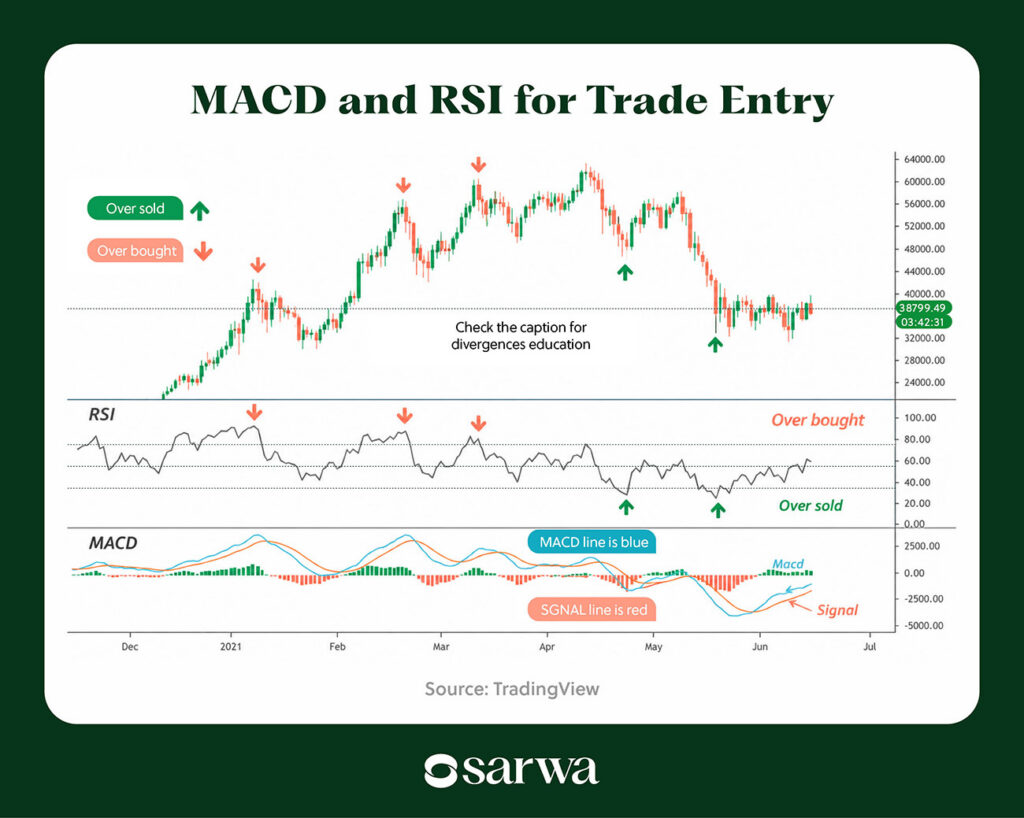
Source: TradingView
Consider the first overbought situation highlighted. The RSI is trading at 80, which confirms that the asset is indeed overbought. At this point, we also see a bearish crossover: the MACD line crossing below the signal line from above. This is a confirmation that the bearish price reversal is probable.
The first oversold situation highlighted follows the same principle. The RSI falls below 30 while a bullish crossover develops: the MACD line crosses above the signal line from below. A price reversal to the upside (though short-lived) followed.
- Double divergences: When both the RSI and MACD diverge from the price chart (strong/medium/weak divergences only) at the same time, there is greater confidence that the expected price reversal will occur.
Below is an example of double divergences:
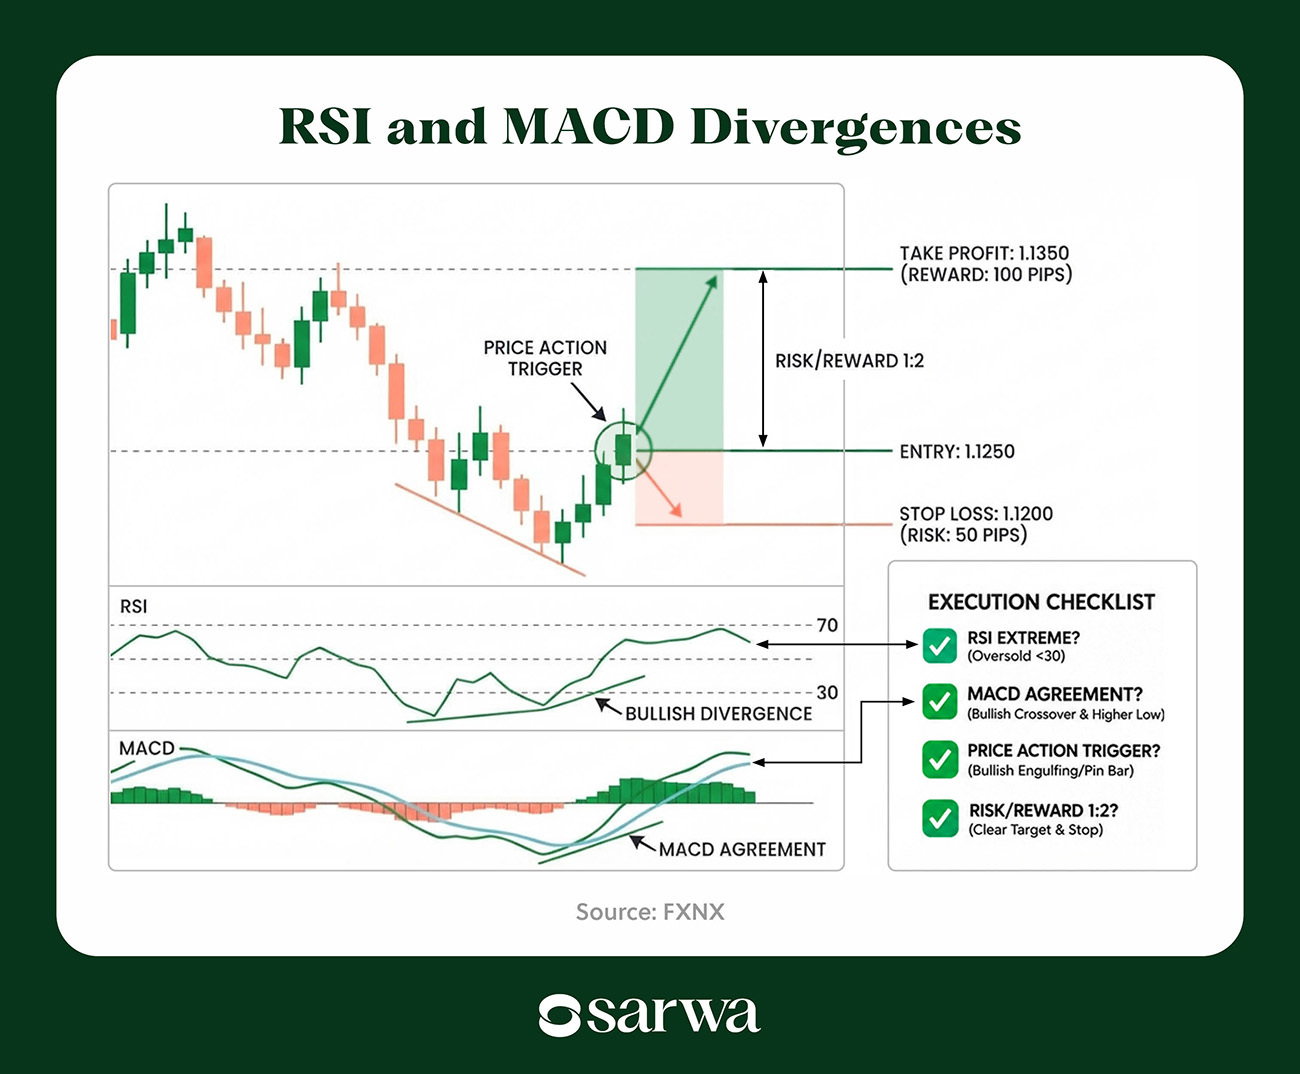
Source: FXNX
The price chart makes lower lows while the RSI and MACD are making higher lows. This is a case of strong bullish divergence. And as we see, price reverses in the direction of the MACD and RSI.
MACD and candlestick chart patterns
Many traders also use the MACD and candlestick chart patterns to confirm one another before entering a trade.
In some cases, the MACD is the main signal while the candlestick chart pattern acts as a confirmation. But the reverse can also be the case.
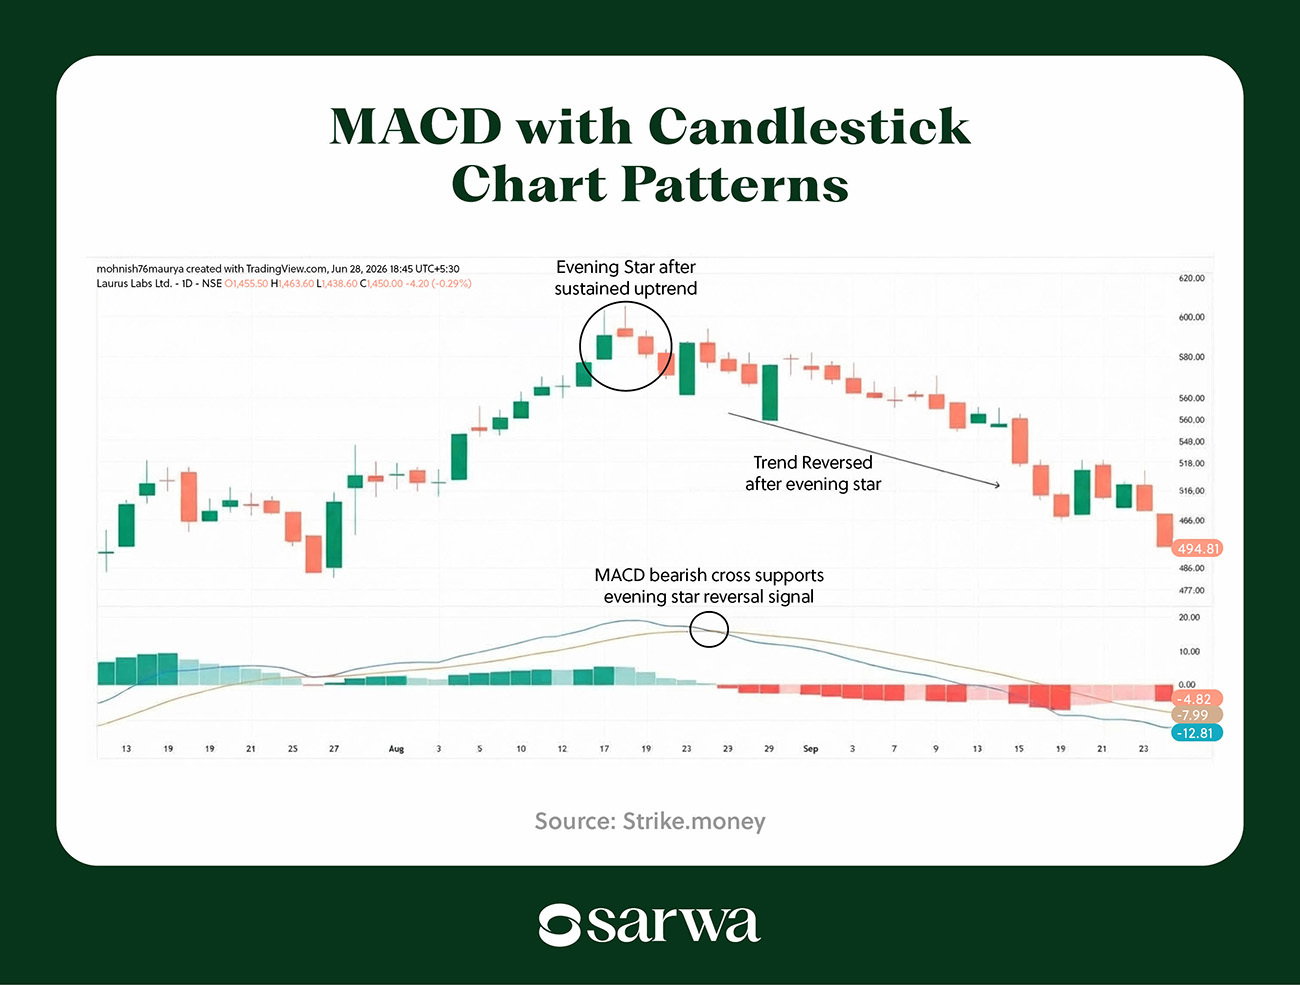
Below is an example of the MACD acting as a confirmation signal:
Source: Strike.money
Here, an evening star candlestick chart pattern suggests a potential price reversal, while a bearish MACD crossover confirms it.
Suggested reading: 18 Candlestick Chart Patterns: Cheat Sheet For New Traders
Confirming market trend with moving averages
The MACD zero line can help with identifying trend direction, as we have seen.
Some traders verify the trend direction reading from the zero line with moving averages.
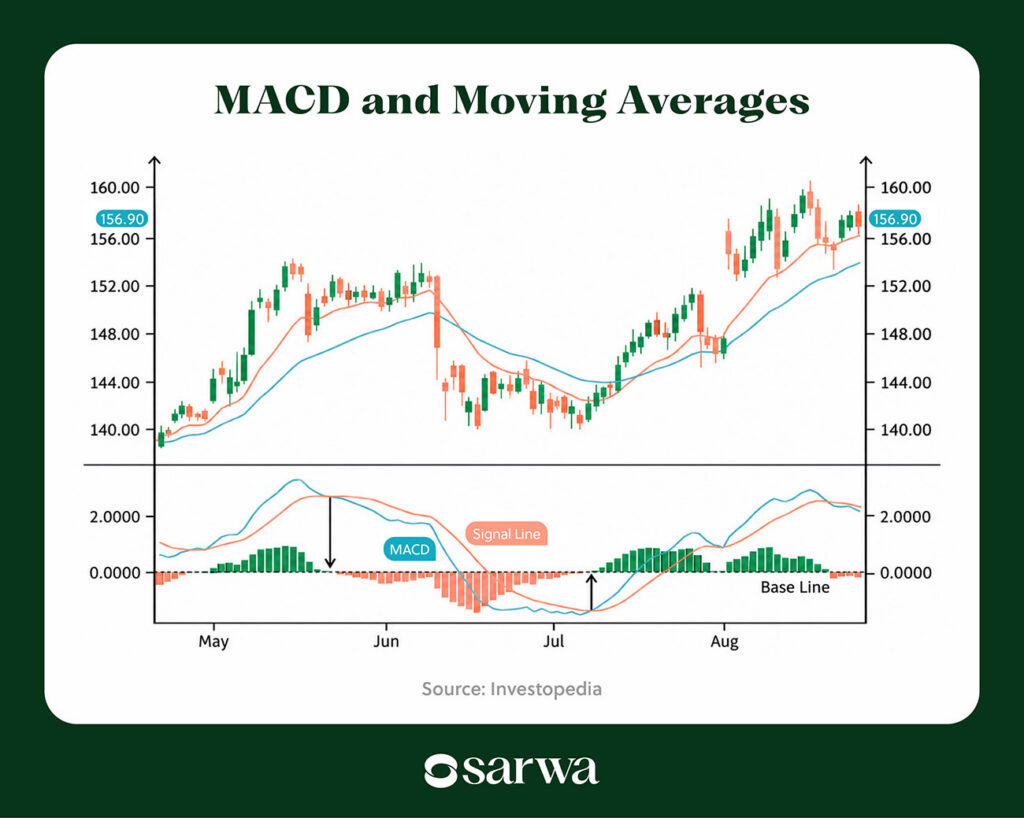
Source: Investopedia
In the early days of May, the histogram bars are above the baseline, which shows that the market trend is bullish. This is confirmed by the price being above the moving averages.
Confirming potential price reversals with support and resistance lines
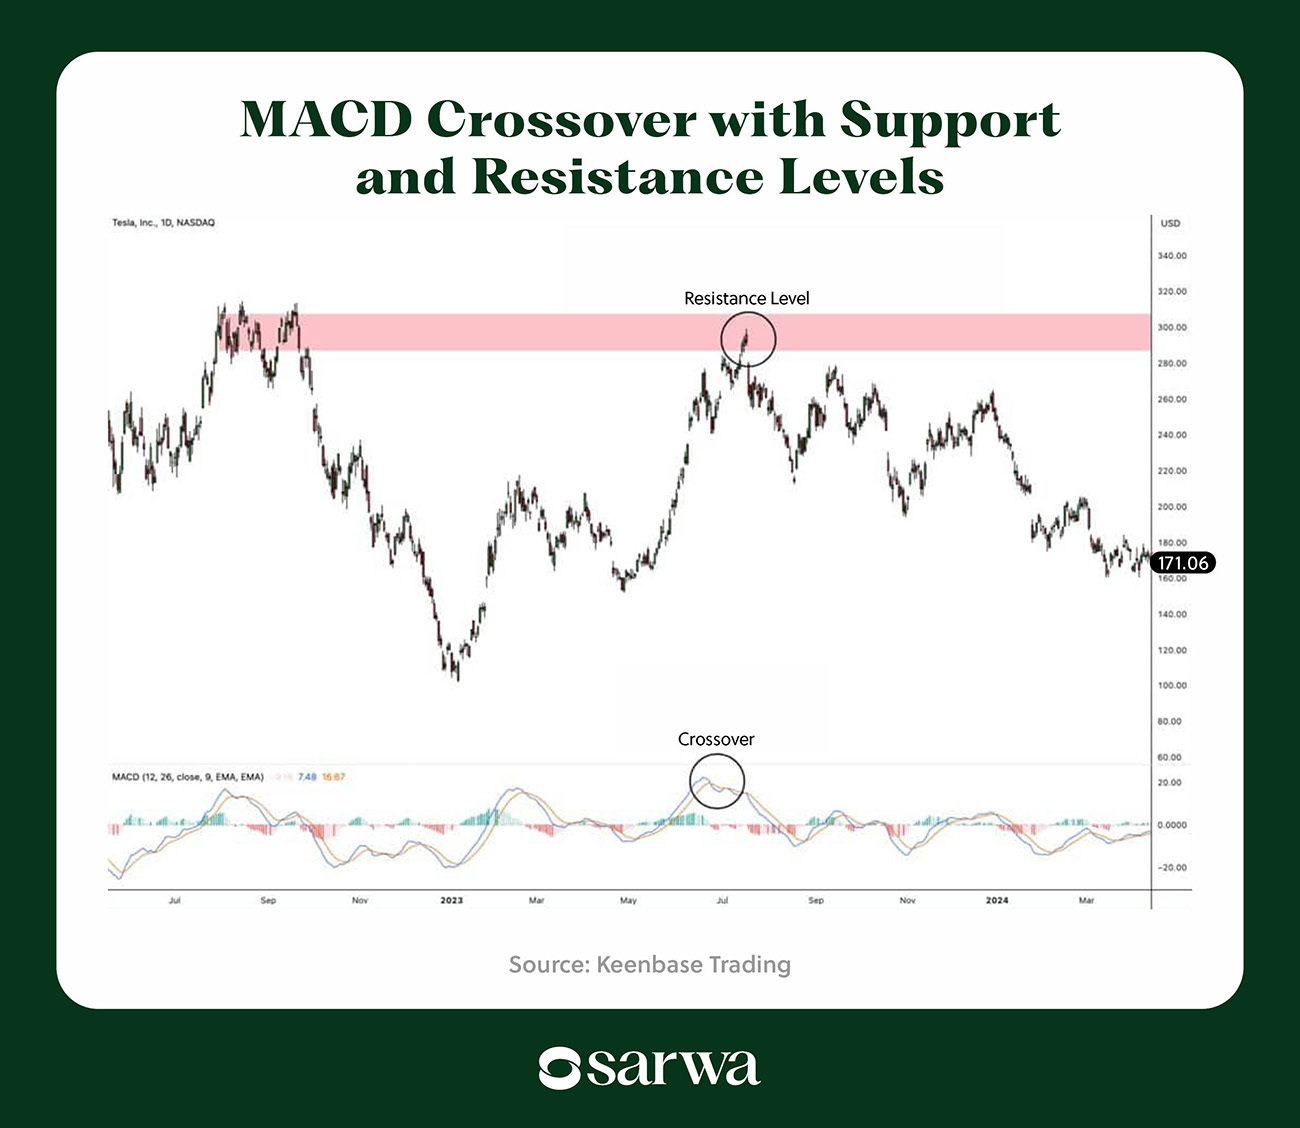
A MACD crossover occurring at a support or resistance zone is an additional confirmation that a price reversal is probable.
Below is an example:
Source: Keenbase Trading
Here, a bearish crossover occurs at a resistance zone, and this was followed by a price reversal to the downside.
5. Tips for using the MACD indicator
When used properly, the MACD indicator can be a powerful tool for traders.
Consider some of these tips to get better value from the indicator:
- Don’t use the MACD in isolation: As we have seen, experienced traders combine the MACD with candlestick chart patterns, support and resistance zones, and other indicators to increase the probability that they are taking the right trade.
- Consider adjusting the MACD settings: The MACD indicator uses the 12EMA, 26EMA, and 9EMA as default settings. However, some traders like to tweak the timeframe to match their trading style and goals.
For example, day traders and those who trade highly volatile assets can shorten the EMAs to make the indicator react faster to price changes. On the other hand, position traders and those who trade slower-moving markets can lengthen the EMAs to filter market noise.
“For settings, I like 8/21/5 when the decision window is short, and I use 19/39/9 when I’m checking the bigger trend,” according to Dale Gremillion, Senior Loan Officer at Golden State Mortgage, a mortgage financing company, and a stock trader.

- Trade in the direction of the trend: MACD signals are more reliable when they align with the broader market trend. In an uptrend, focus on bullish crossovers; in a downtrend, watch for bearish crossovers. If you will take countertrend trades, ensure they are confirmed by strong divergence or reversal patterns.
- Filter out false signals: As a momentum indicator, the MACD functions well in trending markets. Sideways markets can produce whipsaws, as the MACD line and the signal line cross each other repeatedly over a short period.
Trading such whipsaws can lead to false signals, with many traders being misled to buy high and sell low repeatedly.
“The main mistake traders make when using MACD is treating signal line crossovers as automated trading signals in range-bound, sideways markets,” according to Kirill Meshyk, Head of AI Data Collection at Unidata, a platform providing data solutions to LLMs. “In consolidation, moving averages merge and produce constant signal line crossovers that erode trading capital. We take a different approach and use MACD solely as a trend continuation filter (during range-bound consolidation) and signal confirmator (during trending).”

Once you have built a comprehensive strategy that includes the MACD indicator, the next step is execution.
At Sarwa Trade, we provide you with the right trading environment that will help you execute your trading strategies efficiently. With us, you can buy fractions of stocks, ETFs, and cryptocurrencies. You can also create market and limit orders, depending on your entry and exit targets.
Transfers between your Sarwa Trade account and your local bank account are free, and you can get started trading global assets with a minimum balance of $500.
Sarwa Trade is regulated by the Financial Services Regulatory Authority (“FSRA”) in the Abu Dhabi Global Markets (“ADGM”), and it uses bank-level SSL security to protect your data.
Are you ready for cost-effective and secure access to global assets in the UAE? Sign up now for Sarwa Trade to start trading your favorite assets.
Takeaways
- MACD measures momentum and trend direction by comparing short- and long-term exponential moving averages.
- MACD crossovers and the histogram provide different signals; crossovers can indicate potential entries or exits, while histogram changes help identify accelerating or fading momentum.
- Like other indicators, MACD works better with confirmation. RSI, price action, candlestick patterns, moving averages, and support and resistance can help filter weaker signals.
- Avoid relying on MACD in sideways markets. Repeated crossovers can create false signals, making the indicator more useful when a clear trend is present.
Frequently Asked Questions
1. Is MACD a leading or lagging indicator?
MACD is generally considered a lagging indicator because it is calculated from historical price data and moving averages. As a result, MACD signals typically appear after a price movement has already begun. Traders often combine MACD with price action, support and resistance, or other indicators to improve signal confirmation.
2. What does it mean when the MACD histogram changes direction?
A changing MACD histogram can indicate that momentum is accelerating or weakening. When the bars begin expanding, momentum is increasing in the direction represented by the histogram. When they begin shrinking after a period of expansion, momentum may be fading, potentially signaling a change in the current trend.
3. What is the best MACD setting for trading?
The standard MACD setting is 12, 26, 9, meaning a 12-period EMA, 26-period EMA, and 9-period signal line. However, there is no single setting that works best for every trader or market. Shorter settings can make MACD react more quickly to price changes, while longer settings can reduce some short-term market noise. The appropriate setting depends on the trader’s timeframe, strategy, and the asset being analyzed.