
Every candle on a price chart tells a story that summarizes market sentiment. For centuries, traders have used these charts to tell a story about what the market is doing and what it is expected to do.
As a new trader, understanding candlestick chart patterns is a crucial step to mastering the financial markets and finding opportunities when others see confusion. It is also an important component of creating a trading strategy that takes the guesswork out of trading, irrespective of the asset class.
In what follows, we will introduce you to the world of candlesticks and help you get a good hang of the most important candlestick chart patterns that expert traders use. We’ll cover:
- What is a candlestick?
- Types of candlesticks
- An introduction to candlestick chart patterns
- 18 popular candlestick chart patterns for new traders
- How to use candlestick chart patterns
Are you interested in knowing more about how to study the financial markets and identify trading opportunities? Subscribe now to Sarwa’s Fully Invested newsletter for expert insights.
1. What is a candlestick?
A candlestick chart is a visual representation of price movement within a given timeframe. It is one of the popular ways of summarizing price information in technical analysis. Other charts include line charts, bar charts, and point and figure charts, among others.
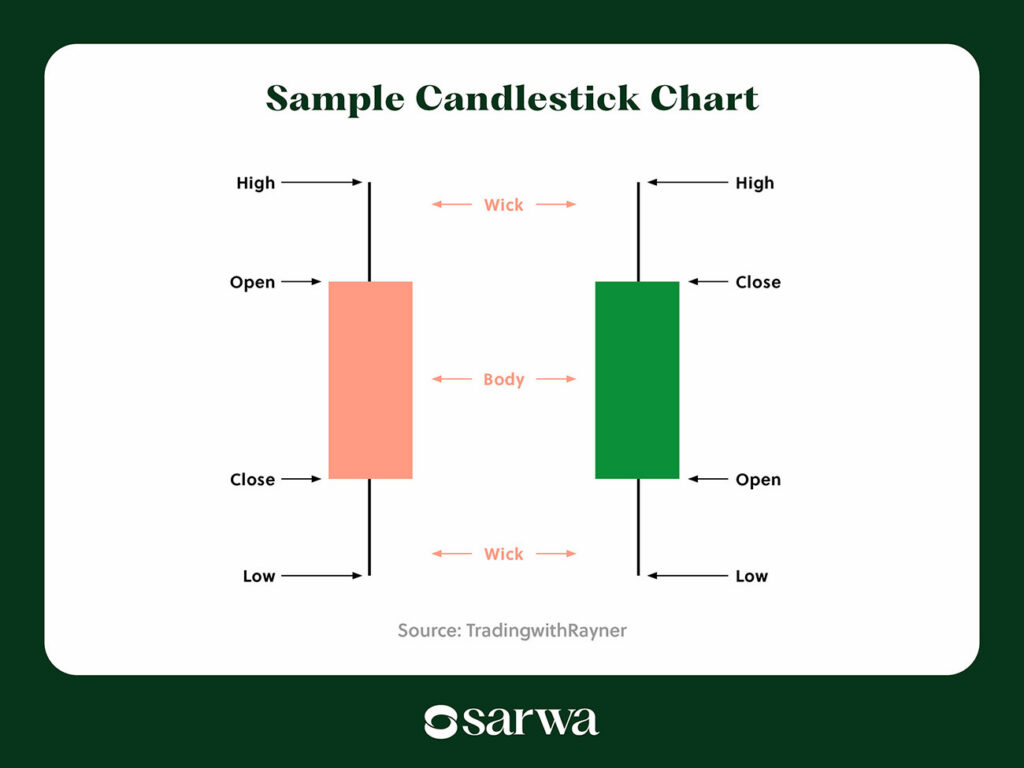
The price information that a candlestick chart summarizes includes the opening price, the closing price, the highest price, and the lowest price within the given timeframe (one minute, 15 minutes, 30 minutes, 1 hour, 4 hours, a day, a week, etc.).
Below is an example of a candlestick chart:
Source: TradingwithRayner
There are two main parts to a candlestick chart: the body (also called the ‘real body’) and the wick. The body represents the opening and closing prices, while the wick represents the highest and lowest prices.
A stock market candlestick looks the same as a forex candlestick, and they provide the same information. In other words, candlesticks are generally asset-agnostic. The difference lies in the interpretation.
2. Types of candlesticks
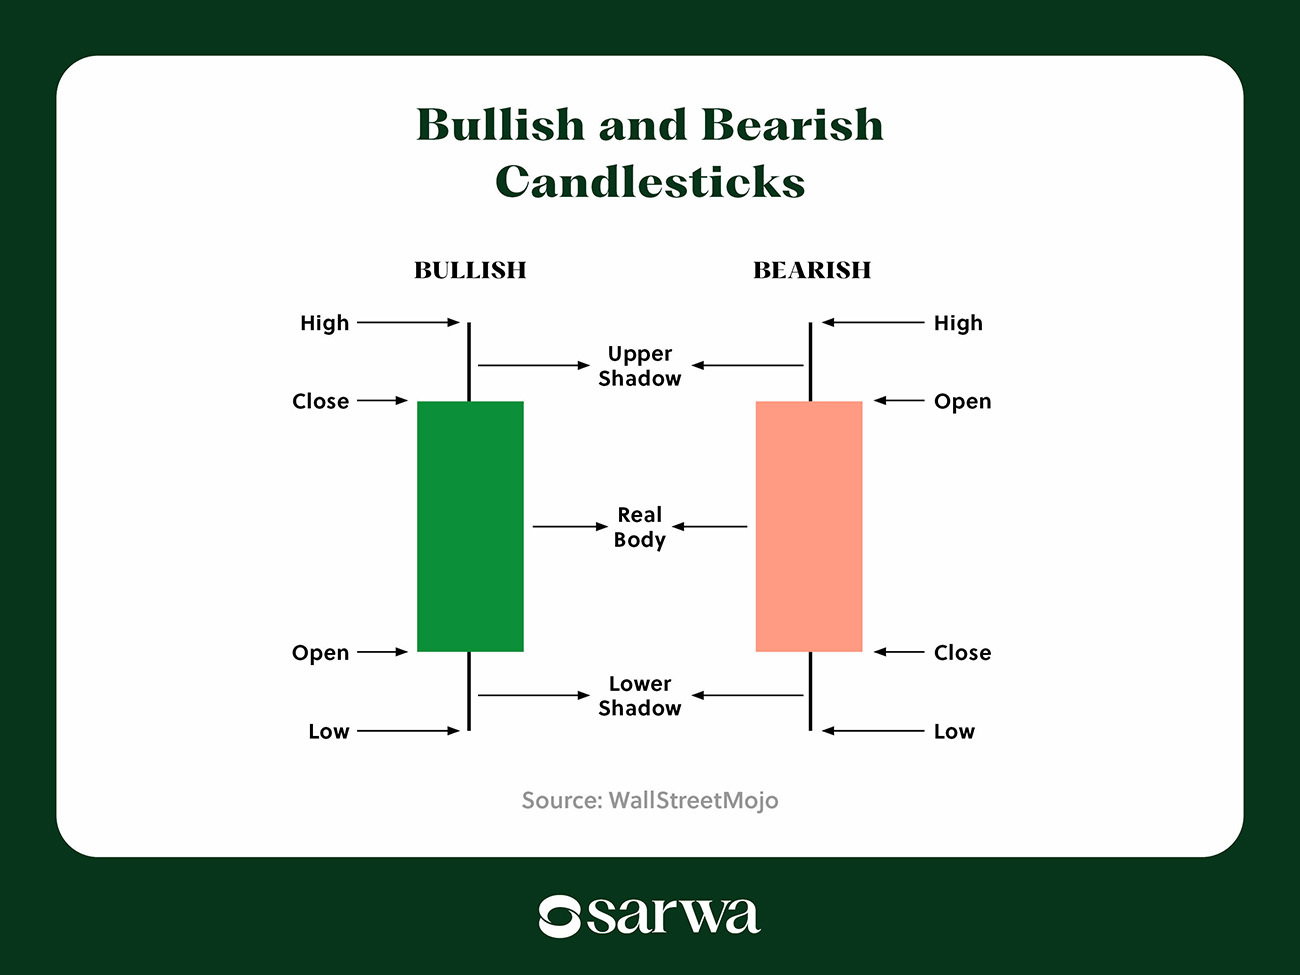
A candlestick chart can be bullish or bearish.
When a candlestick is bullish, it means the bulls are in control within that given timeframe. As seen in the chart below, a bullish candlestick closes higher than it opens, and it is usually colored green on technical charts.
Source: WallStreetMojo
A bearish candlestick closes lower than it opens, indicating that the bears took over the market within the given timeframe. Bearish candlesticks are usually colored red on charting platforms.
3. An introduction to candlestick chart patterns
As technical traders have studied candlestick charts over the centuries, they have noticed some repeatable patterns that provide information about market sentiment. With this information, many have predicted future price movements to a varying degree of success.
Put simply, a candlestick chart pattern is a visual formation created by one or more candlesticks on a price chart.
Candlestick charts are said to go back to Munehisa Homma, an 18th-century Japanese rice trader, who drew them to represent the patterns he noticed in rice prices.
Most of the candlestick chart patterns we know today were introduced by Steve Nison in the book Japanese Candlestick Charting Techniques, published in 1991.
As said above, candlestick chart patterns communicate market sentiment, and an understanding of this sentiment can help to make price predictions. Therefore, we can classify candlestick chart patterns in two ways.
First, if we classify by market sentiment, there are three types of candlestick chart patterns:
- Bullish candlestick chart patterns: These are candlestick chart patterns that show that market participants are bullish about the asset in view. In other words, the bulls (buyers) are proving to be stronger than the bears (sellers).
- Bearish candlestick chart patterns: These candelstick chart patterns reveal that market participants are bearish about a given asset. Said differently, the sellers are proving to be stronger than the buyers.
- Indecision candlestick chart patterns: These chart patterns reveal a tug of war between sellers and buyers that is yet to be settled one way or the other.
Second, if we classify by potential price movement, we can identify two types of candlestick chart patterns:
- Continuation candlestick chart patterns: These candlestick chart patterns show that it is likely that the current market trend will continue. In other words, if the market is currently bullish, then it is likely to stay bullish, and vice versa.
- Reversal candlestick chart patterns: Reversal candlestick chart patterns show that it is likely that the market trend will change – from bullish to bearish or from bearish to bullish.
Learning how to read candlestick chart patterns becomes easier when you can fit each chart into any of the categories above. As we explore these 18 popular candlestick chart patterns, keep an eye on which category they belong to.
4. 18 popular candlestick chart patterns for new traders
There are tens of candlestick chart patterns that traders have identified over the years.
In this article, we will focus on 18 of the most popular ones, starting with one-candlestick chart patterns and moving on to multiple-candlestick chart patterns.
1. Doji
Overview
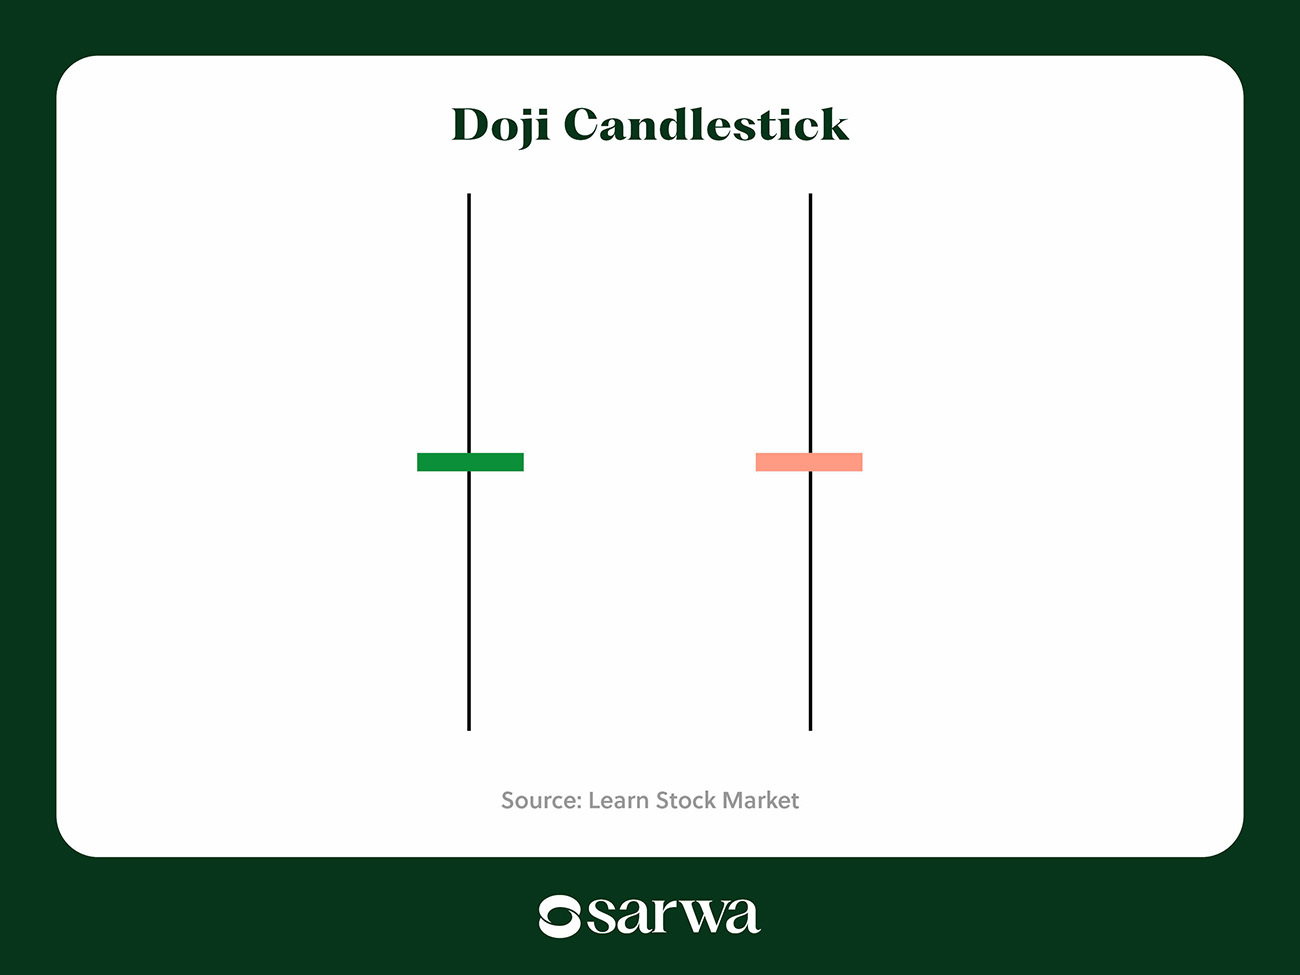
A Doji candlestick chart pattern is formed when the opening and closing prices of an asset are nearly identical, resulting in a very tiny or nonexistent body, as seen below:
Source: Learn Stock Market
A Doji looks like a cross or plus sign with its long wicks extending above and below the thin body.
As the chart above shows, a Doji candlestick can be bullish or bearish.
Interpretation
In terms of market sentiment, a Doji is an indecision candlestick chart pattern. The bulls and bears are locked in a tug of war, and neither can put their stamp on the market, resulting in almost identical opening and closing prices.
When it comes to price direction, some traders also interpret Doji as a reversal candlestick chart pattern. The reasoning is that if a Doji appears at the end of a strong trend, then it means the trend is on its last leg, and a reversal may be imminent. Smart traders will, however, wait for another signal to confirm that a reversal is really in the offing.
2. Dragonfly Doji
Overview
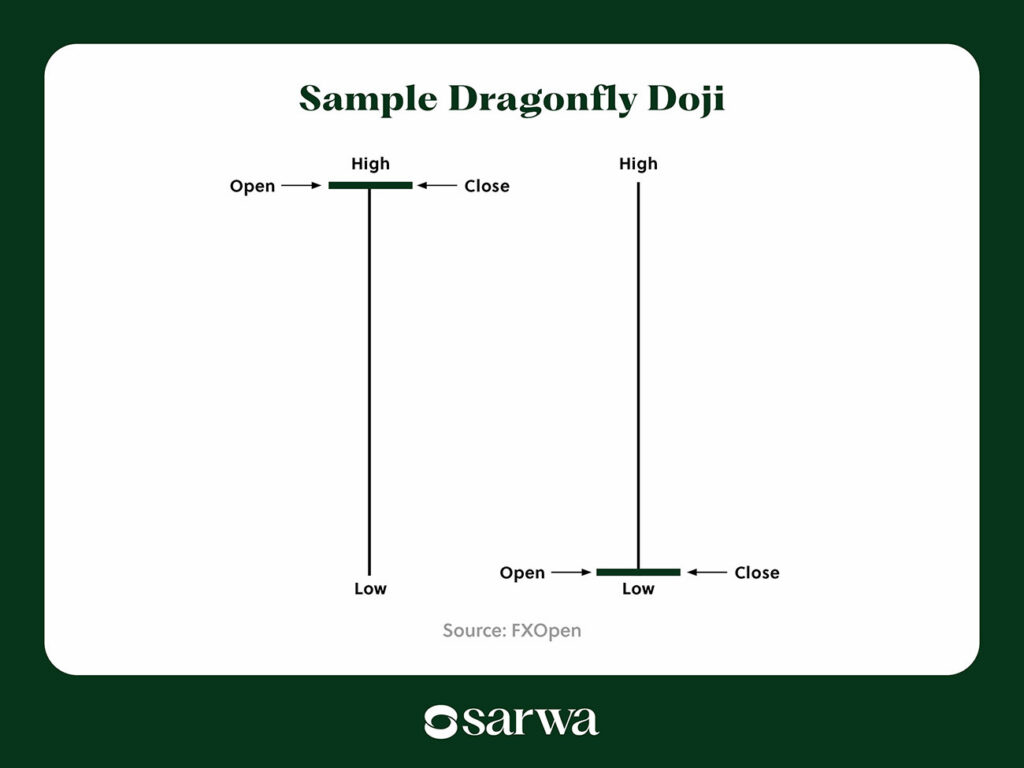
A dragonfly Doji is a type of Doji where the high price is also almost identical to the opening and closing prices. As seen below, this results in a candlestick with a long lower wick and a very small, almost non-existent, upper wick.
Source: FXOpen
Like the Doji, a Dragonfly Doji can either be bearish or bullish, depending on how the opening price compares to the closing price.
Interpretation
A Dragonfly Doji also shows a close battle between the bulls and the bears. However, unlike with a Doji, the bulls ended up gaining control, as seen in the closing price being close to the high price.
Said differently, the seller pushed down prices during the trading session, but the buyers recovered to push them back up. At the end of the trading session, the buyers won since the closing price is close to the high and open prices.
In terms of sentiment, a Dragonfly Doji is bullish. And regarding price prediction, they often appear at the end of a downtrend, signalling a potential reversal to the upside. Again, smart traders will wait for another signal before betting on a reversal.
3. Gravestone Doji
Overview
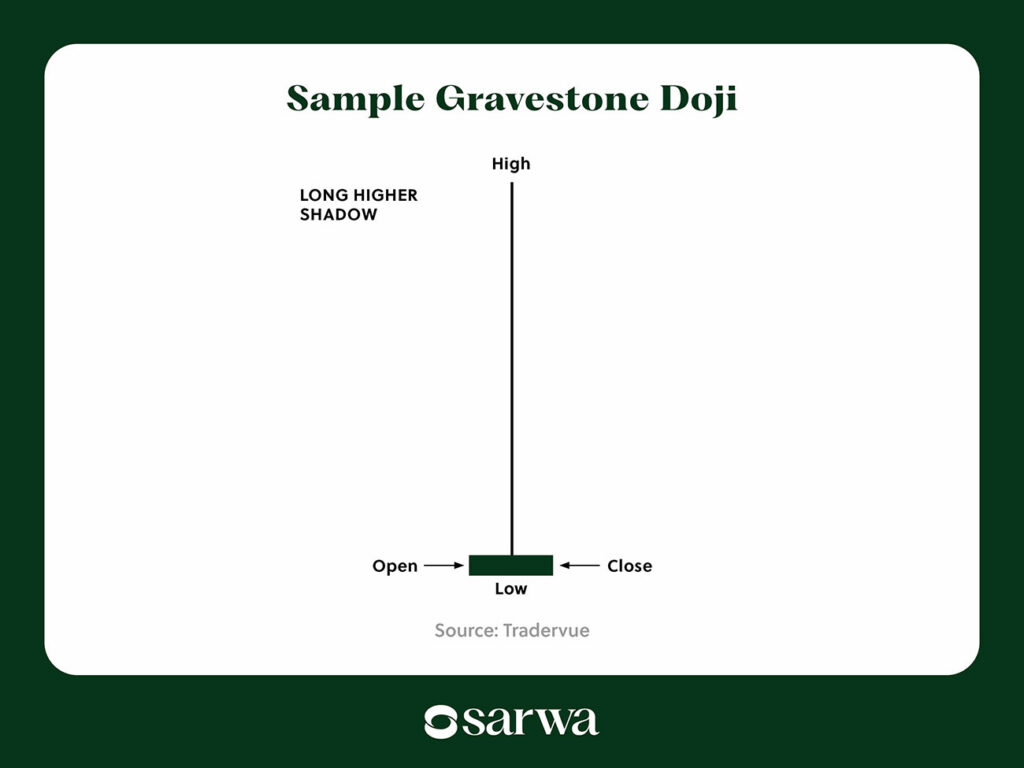
A Gravestone Doji is the bearish counterpart of the Dragonfly Doji. Here, the opening, closing, and low prices are nearly identical, resulting in a thin body and a very small or non-existent lower wick, as seen below:
Source: Tradervue
Interpretation
When the market opened, the bulls took the price up (as far as the high price). However, the bears took over and brought it back to a level close to the opening price, where it eventually closed.
This is a bearish candlestick pattern, and it can be a signal of a potential bearish reversal when it appears at the end of a bullish trend.
4. Hammer Candlestick Pattern
Overview
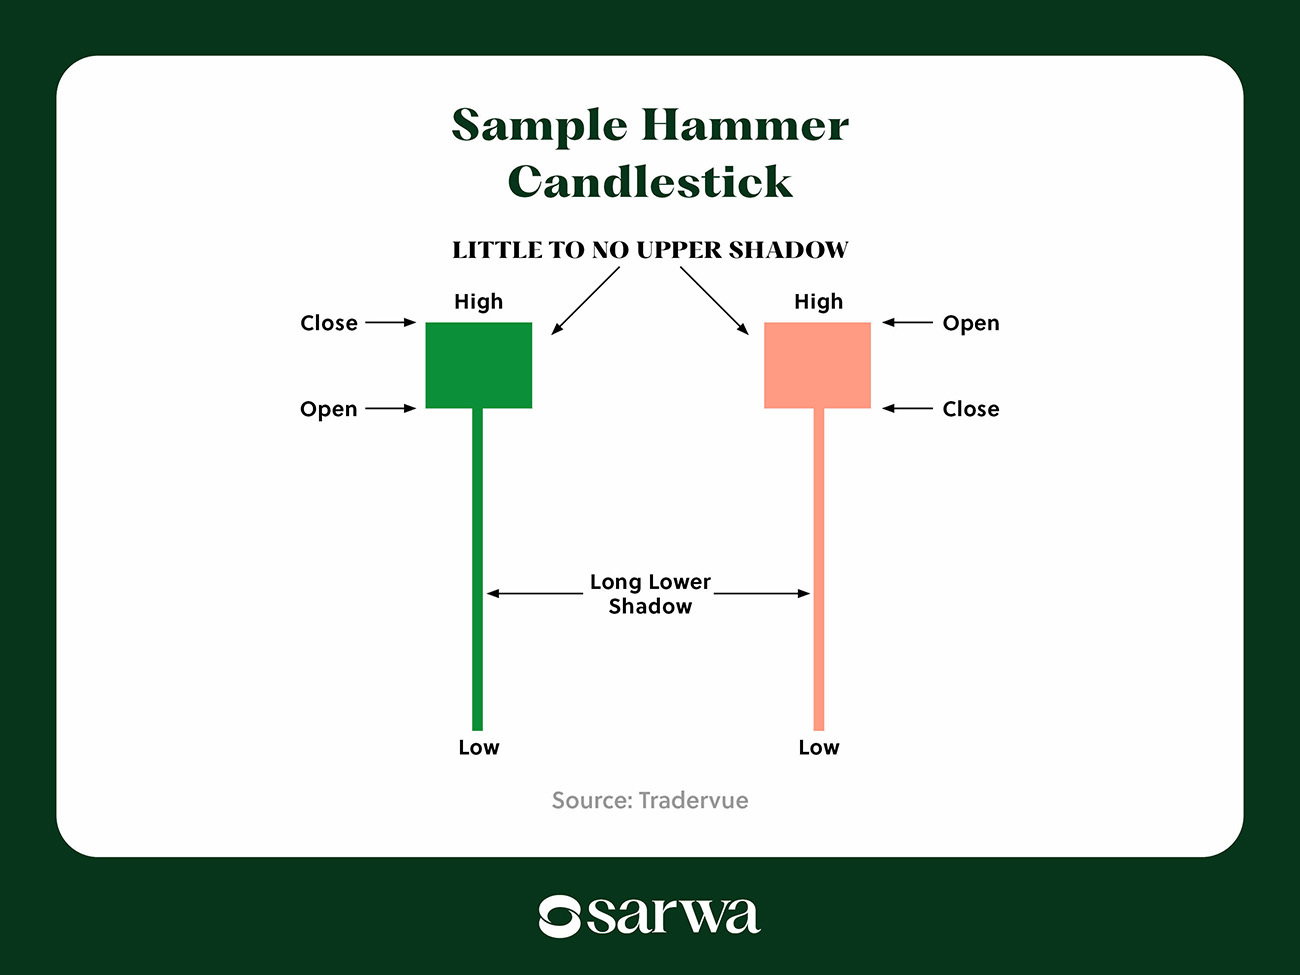
The Hammer candelstick is a single-candle pattern with a small body close to the high price and a long lower shadow. The high price is identical to the close or open price, which is why there is no upper wick.
As seen below, the hammer can be bullish or bearish, depending on which is higher between the close and open price.
Source: Tradervue
Interpretation
The Hammer candlestick pattern is similar to the Dragonfly Doji. Here, the sellers initially take charge, bringing the price down until we get to the lowest point. However, the buyers recover and drag the price back up until it closes near the high and open price.
This candlestick chart pattern is bullish, and it can also signal a bullish reversal if it appears at the end of a downtrend.
5. Inverted Hammer
Overview
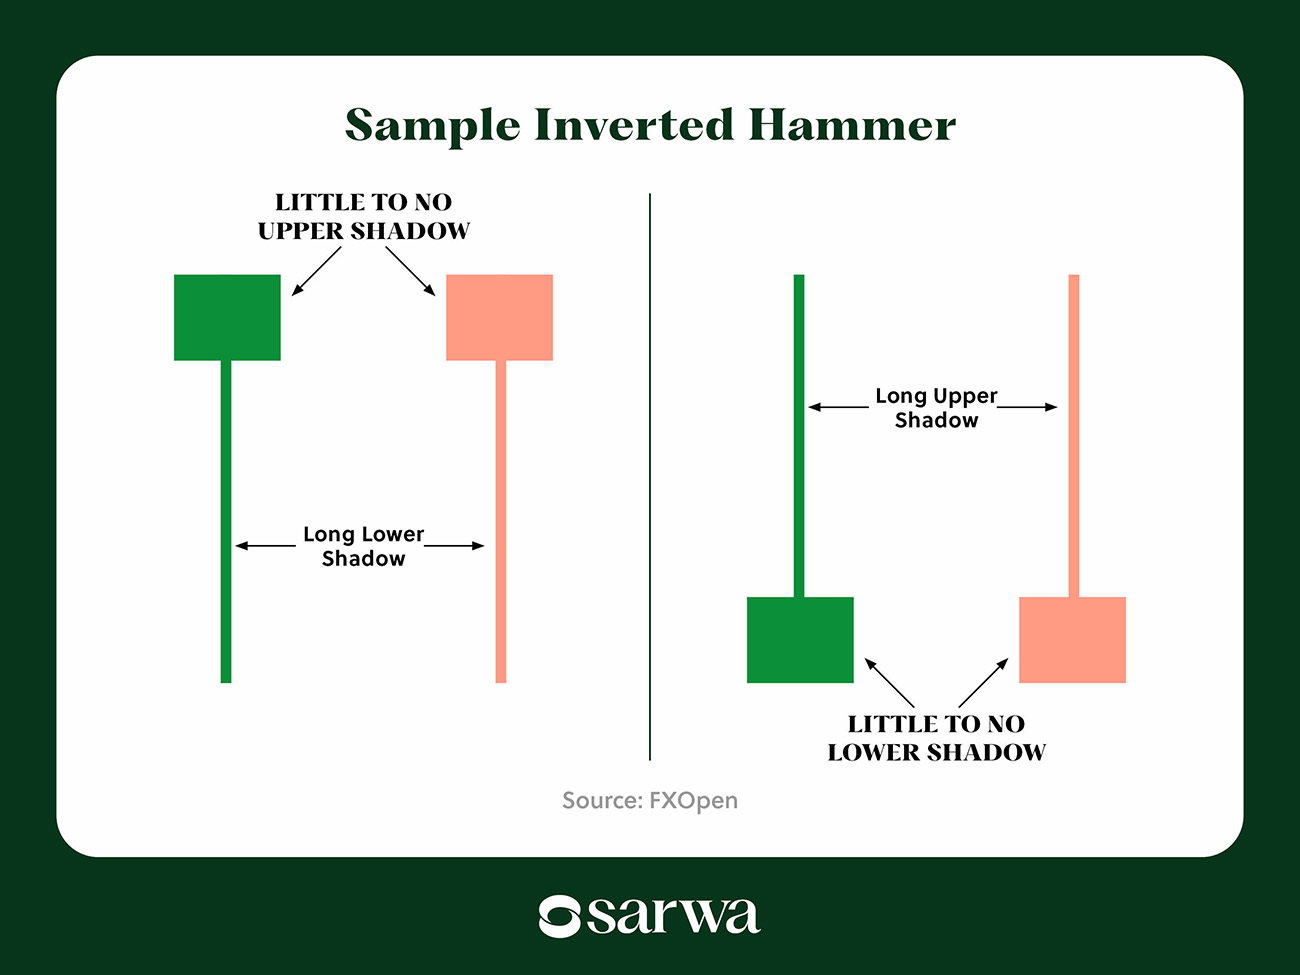
The Inverted Hammer candlestick has a long upper shadow with the body close to the low price.
Source: FXOpen
Interpretation
When it appears at the end of a downtrend, it can signify a potential bullish reversal. Although the bears succeeded, it shows that the bulls are putting pressure on them, which means a reversal can happen next.
6. Bullish Spinning Top
Overview
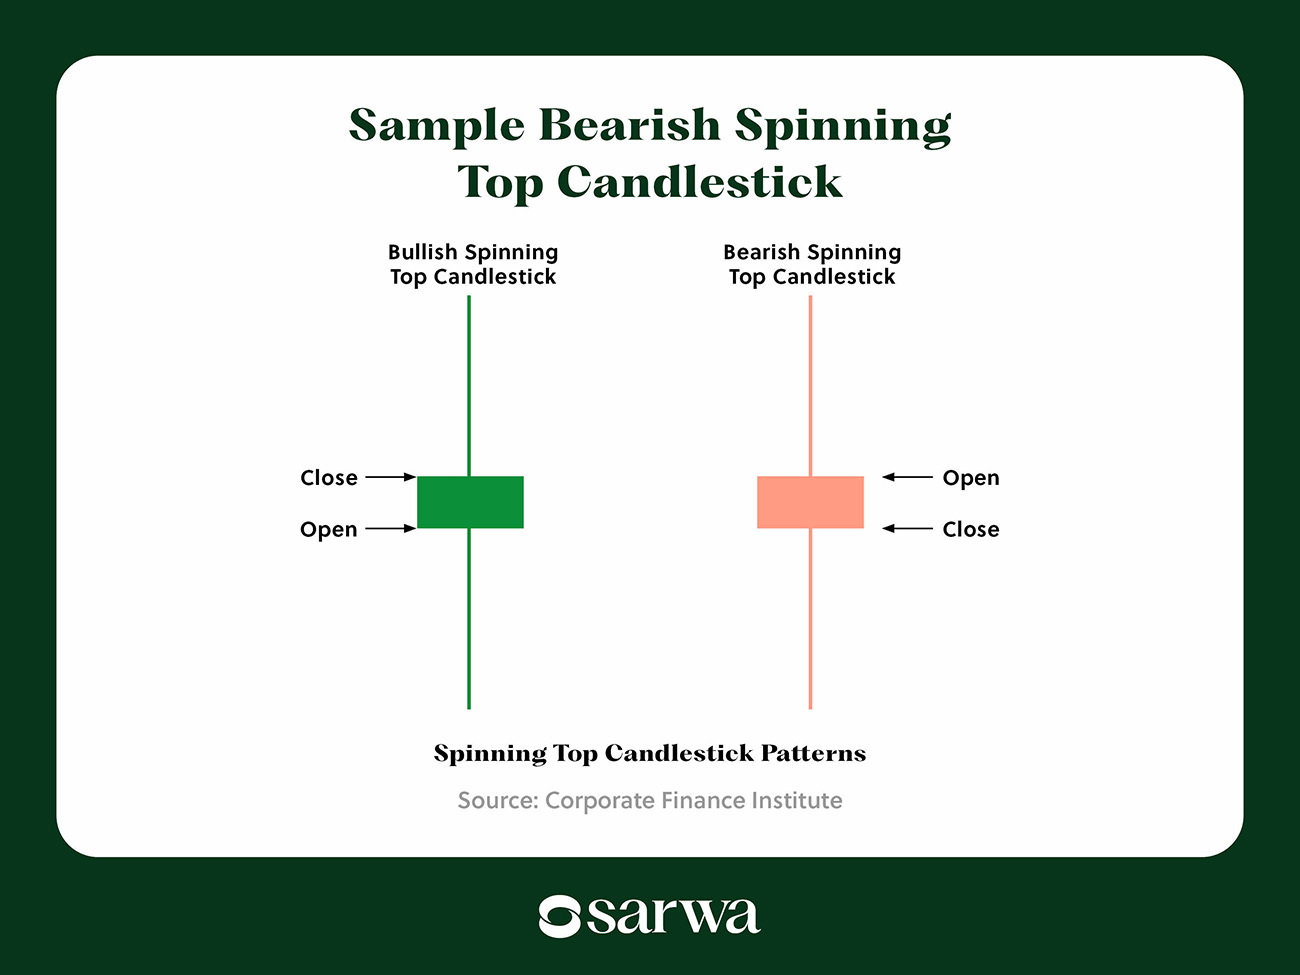
The Bullish Spinning Top candlestick pattern is characterized by a small body in the middle of the candle with long upper and lower shadows. This bullish version has the close price above the open price.
Source: Corporate Finance Institute
Interpretation
The body being in the middle of the candle signifies that neither the sellers nor the buyers dominated the market, with the asset closing near its open price. In other words, it indicates an indecisive market.
When it appears at the end of a bearish trend, some traders see it as a sign that the buyers are stepping up and the bearish trend may be weakening, if not due for a reversal.
7. Bearish Spinning Top
Overview
The Bearish Spinning Top Candlestick is a bearish version of the Bullish Spinning Top Candlestick. Here, the open price is higher than the close price.
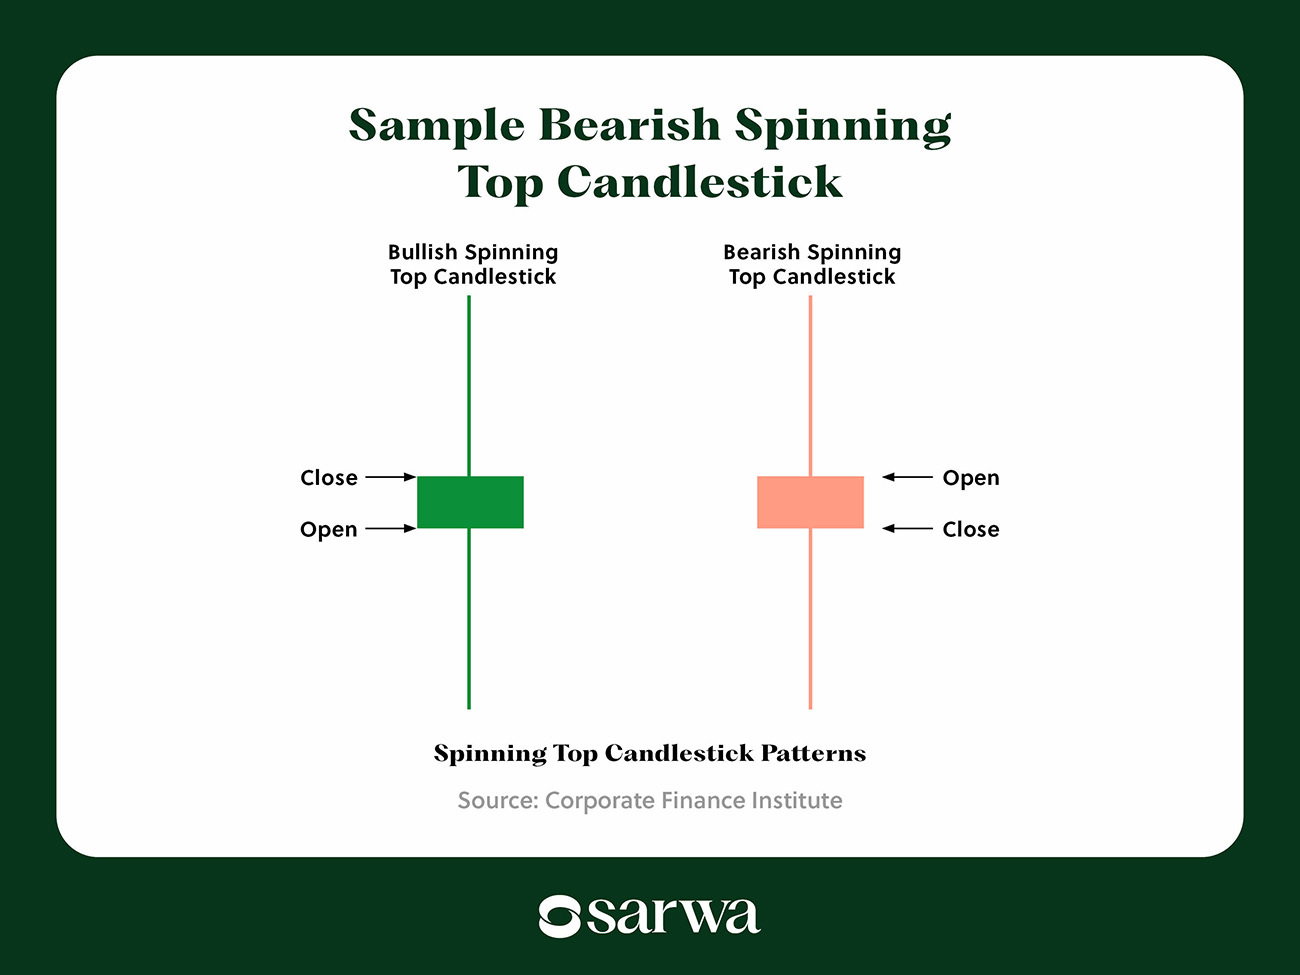
Source: Corporate Finance Institute
Interpretation
This is also an indecision candlestick chart pattern.
When it appears at the end of a bullish trend, it is a sign that the bears are getting stronger and that the bullish trend may be weakening, if not due for a reversal.
8. Bullish Engulfing
Overview
The Bullish Engulfing Candlestick Chart Pattern is a two-candle setup that usually appears at the end of a downtrend.
The first candle is small and bearish, and it is followed by a large bullish candle. Also, the bullish candle engulfs the bearish candle, closes above its open price, and opens at or lower than its close.
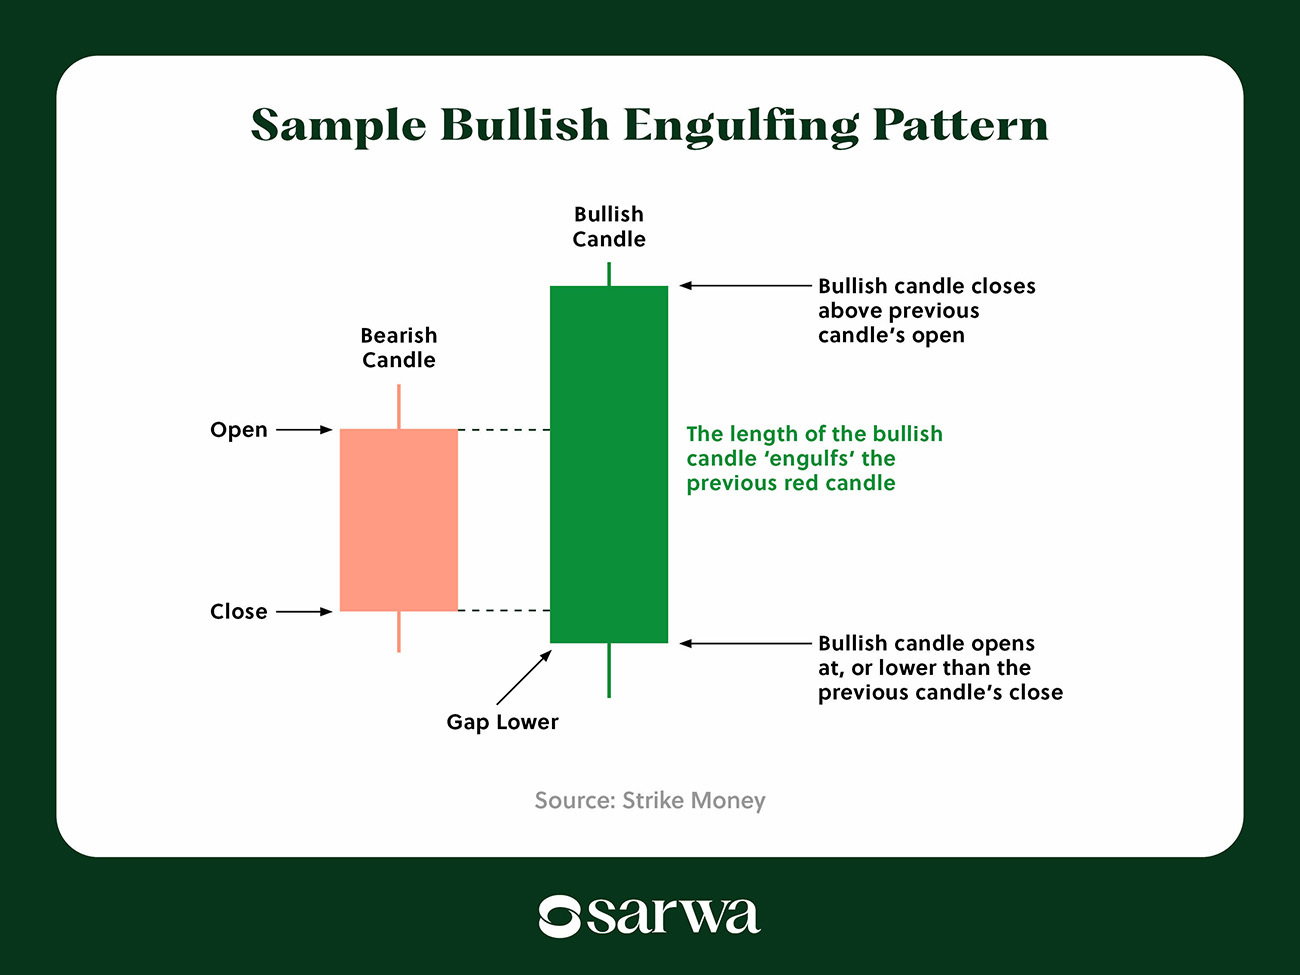
Source: Strike Money
Interpretation
The Bullish Engulfing pattern shows that buyers have dominated the sellers. Though the market opens lower, the buying pressure pushes prices up to the extent that it closes above the high of the previous candle.
It is a bullish candlestick pattern and is also interpreted as the beginning of a new uptrend.
9. Bearish Engulfing
Overview
The first candle is small and bullish, and it is engulfed by a second candle that is larger and bearish. Also, the bearish candle opens at a price higher than the close of the bullish candle and closes at or lower than its open price.
Sample Bearish Engulfing Pattern
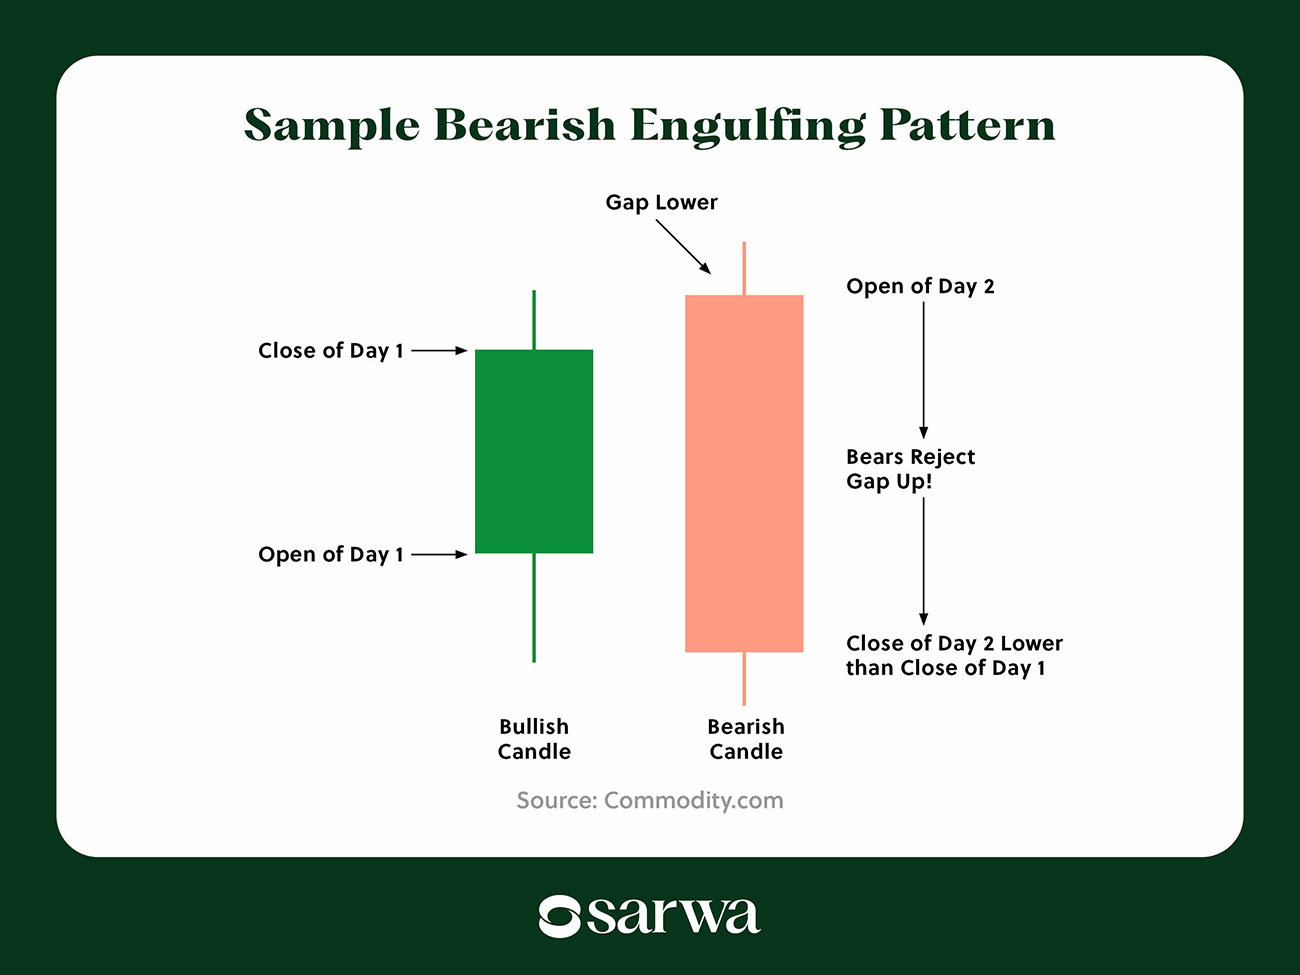
Source: Commodity.com
Interpretation
Sellers have taken over, and it can be the beginning of a downward trend.
10. Piercing Line Pattern
Overview
The Piercing Line Pattern is another two-candle pattern. The first candle is big and red (bearish), while the second is big and green (bullish). The green candle opens below the close of the red candle and closes below its open, but above its midpoint.
Sample Piercing Line Pattern
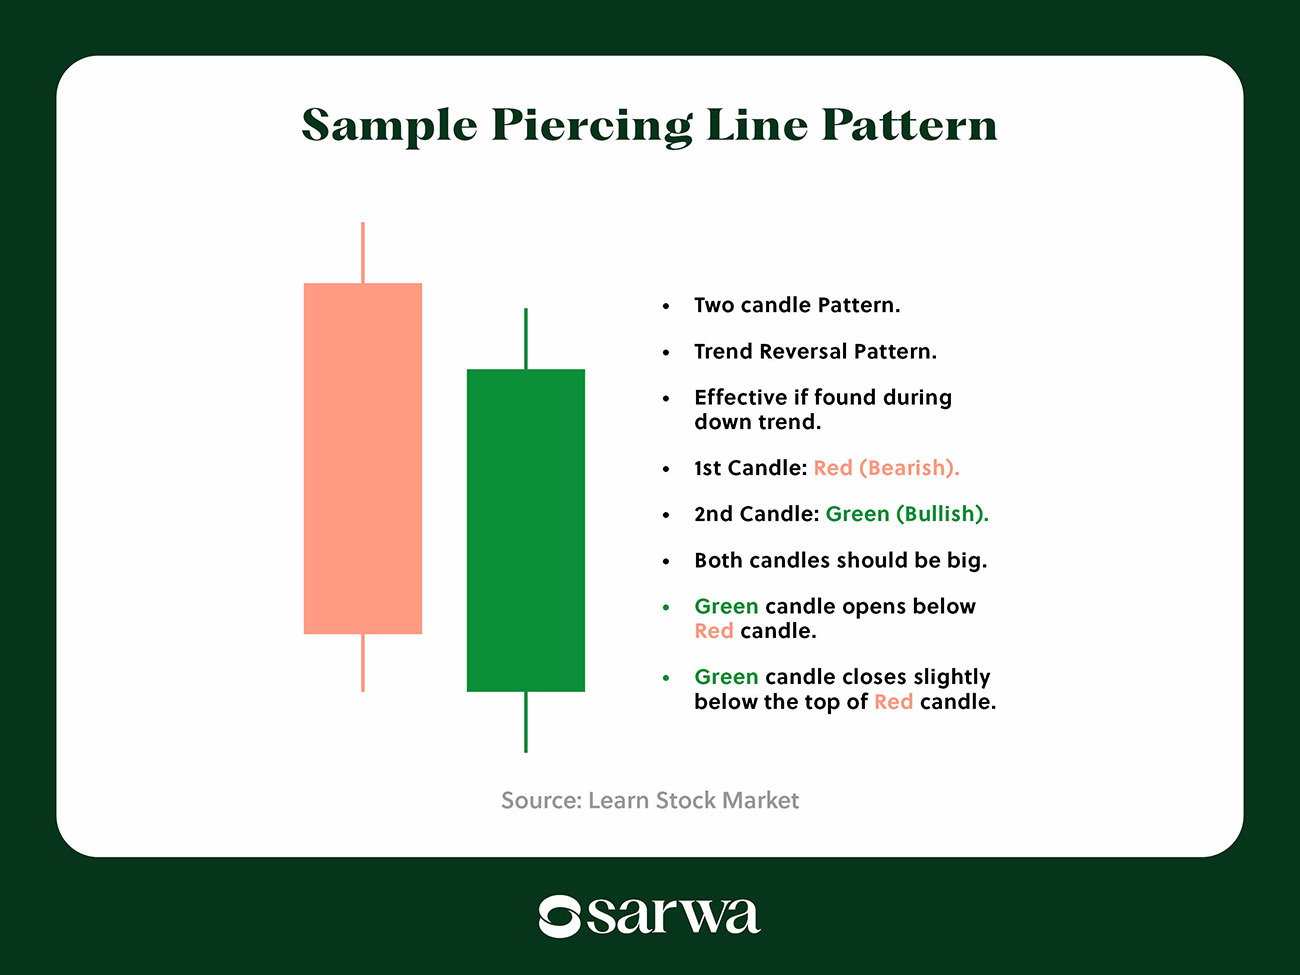
Source: Learn Stock Market
Interpretation
The bullish candle closing far above the close of the bearish candle indicates that buyers stepped in strongly after the sellers had dominated.
Some traders also see it as a sign of a coming reversal, especially when it occurs at the end of a downtrend. Also, the deeper the second candle pierces into the first, the stronger the reversal signal.
11. Tweezer Top
Overview
The Tweezer Top Candlestick Pattern consists of two candles with the same high but different lows. It is usually a bullish candle followed by a bearish one.
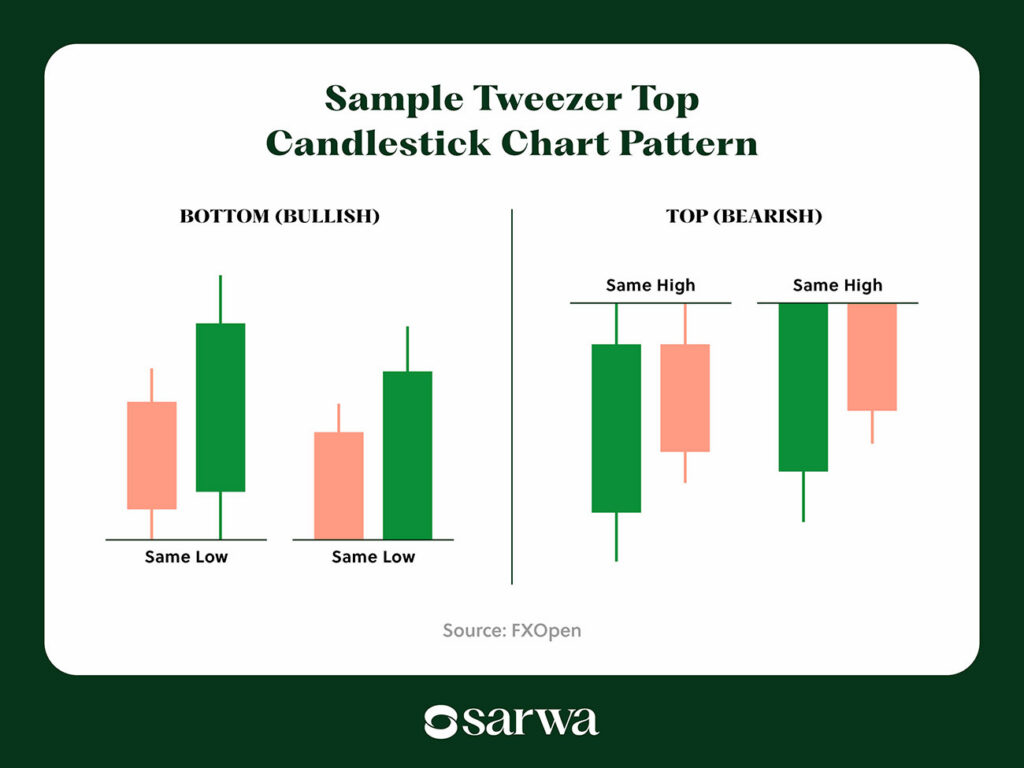
Source: FXOpen
Interpretation
The Tweezer Top shows that the buyers were unable to create a higher high or even maintain the same close price. This is often seen as a weakening of a bullish momentum and the potential start of a downtrend.
12. Tweezer Bottom
Overview
The Tweezer Bottom Pattern features two candles with matching lows. It is usually a bearish candle followed by a bullish one.
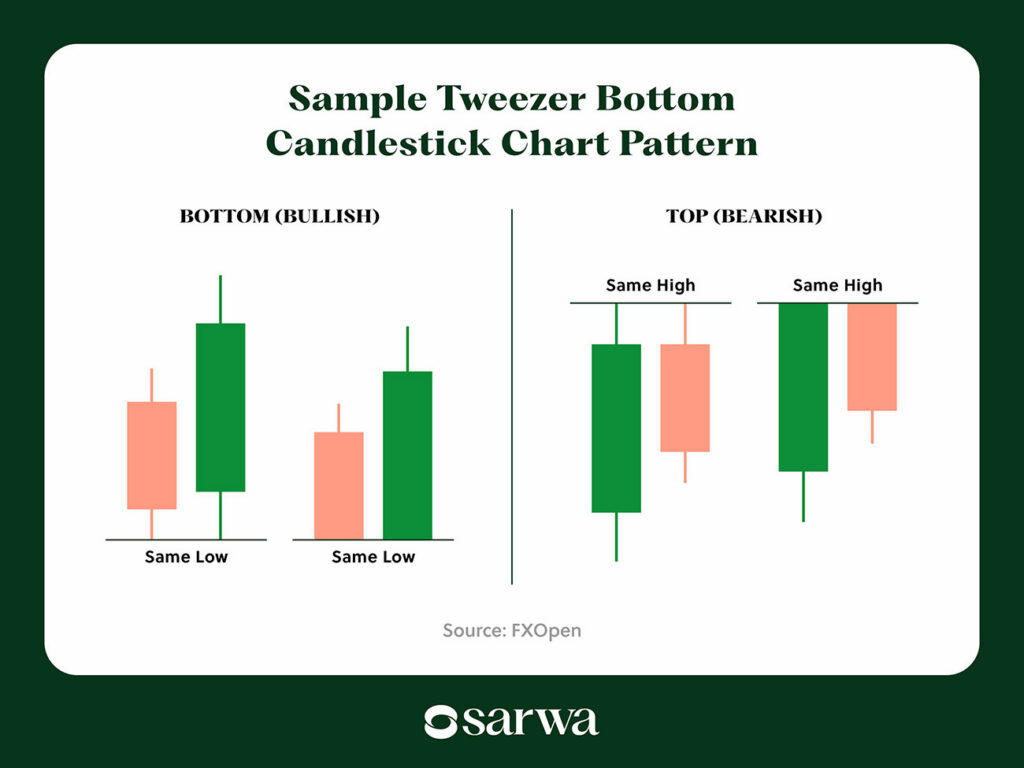
Source: FXOpen
Interpretation
The market is unable to generate a lower low, which shows that the sellers are getting weaker and the buyers are stepping in. Some traders see it as a signal of a potential bullish reversal.
13. Bullish Kicker
Overview
The Bullish Kicker is a bullish reversal signal. It consists of two candles: a large bearish candle followed by a large bullish candle that opens above the bearish candle’s open, creating an upward gap.
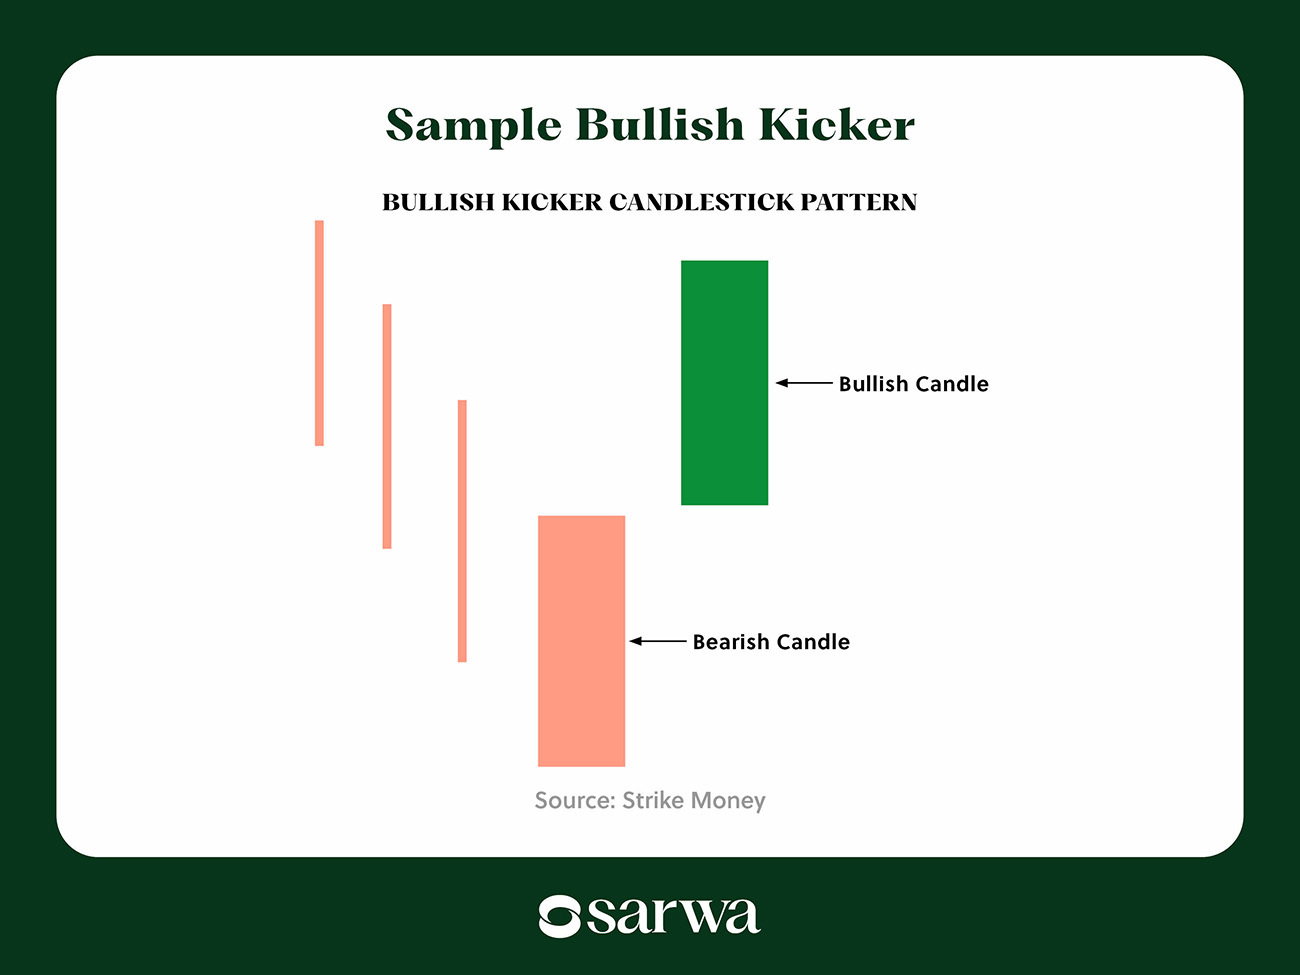
Source: Strike Money
Interpretation
When it appears at the end of a downtrend, the bullish kicker shows a strong buying momentum taking over the market. It can also be interpreted as the beginning of a bullish reversal.
14. Bearish Kicker
Overview
This is a bearish reversal version of the Bullish Kicker. Here, the first candle is bullish, and it is followed by a bearish candle that opens below the open of the bullish candle, creating a downward gap.
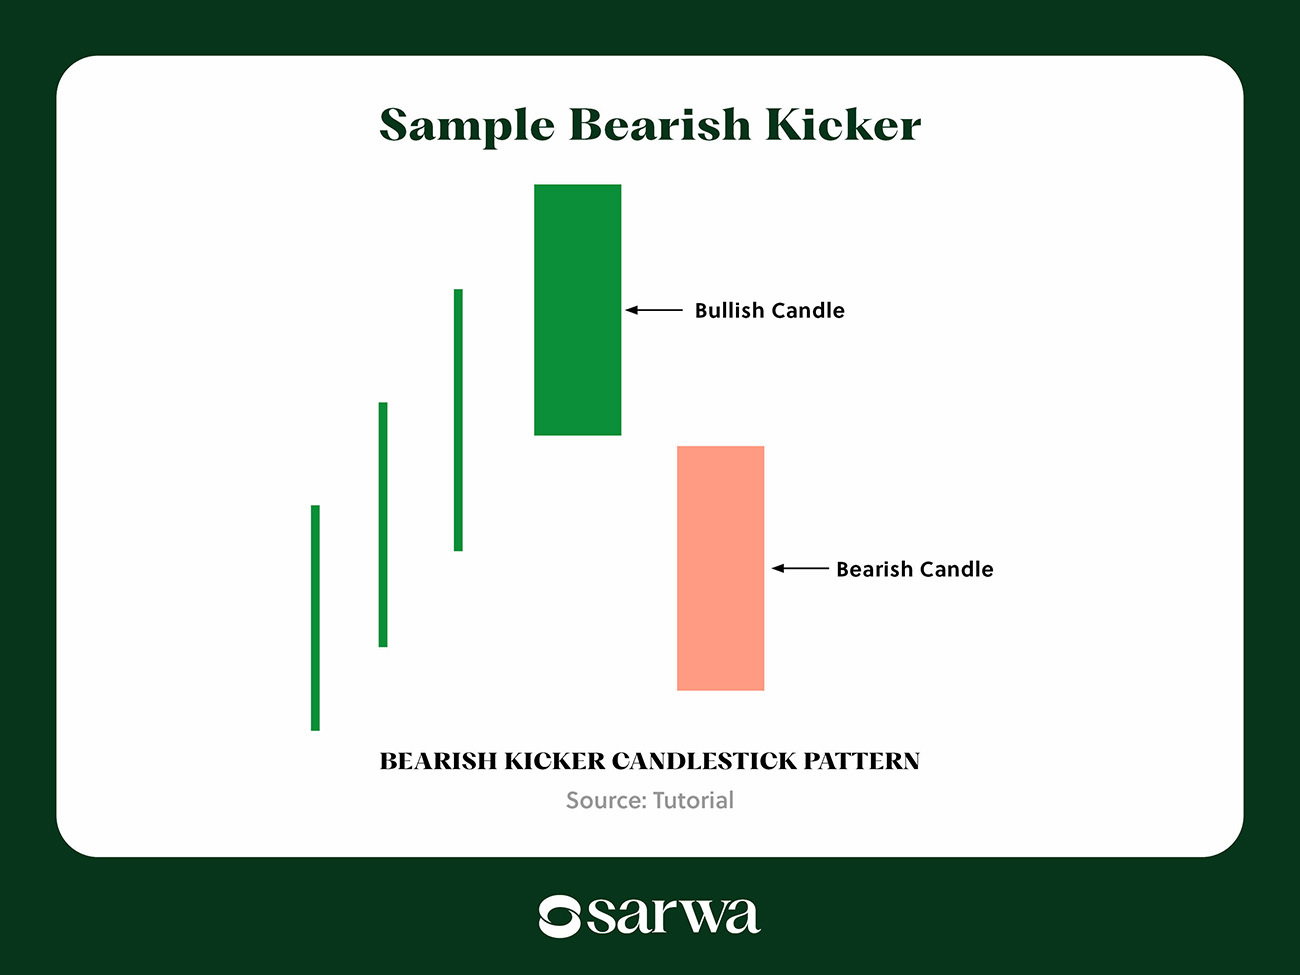
Source: Tutorial
Interpretation
The Bearish Kicker is seen as a sign of a bearish takeover when it occurs at the end of a bullish trend. This takeover can be the beginning of a bearish reversal.
15. Morning Star
Overview
The Morning Star Candlestick Pattern is a three-candle bullish reversal pattern. It consists of a big bearish candle followed by a small indecision candle (can be a Doji or a Spinning Top), which is then succeeded by a big bullish candle that closes well into the body of the first candle.
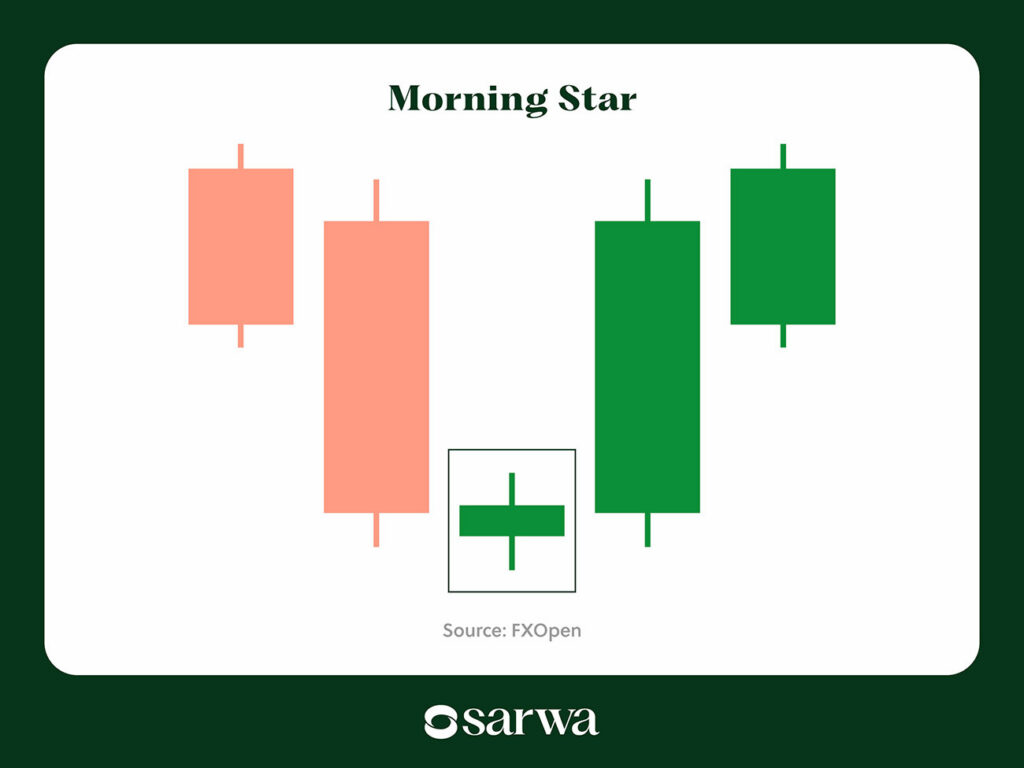
Source: FXOpen
Interpretation
The indecision candle shows that the previous bearish trend has weakened and that a reversal might be in the offing. This potential reversal is confirmed by the big bullish candle, which shows that the buyers have taken over.
16. Evening Star
Overview
The Evening Star Candlestick Chart Pattern is the bearish counterpart to the Morning Star.
The first candle is a big bullish candle, which is followed by a small indecision candle. This pattern is formed by a third big and bearish candle that closes well into the body of the first candle.
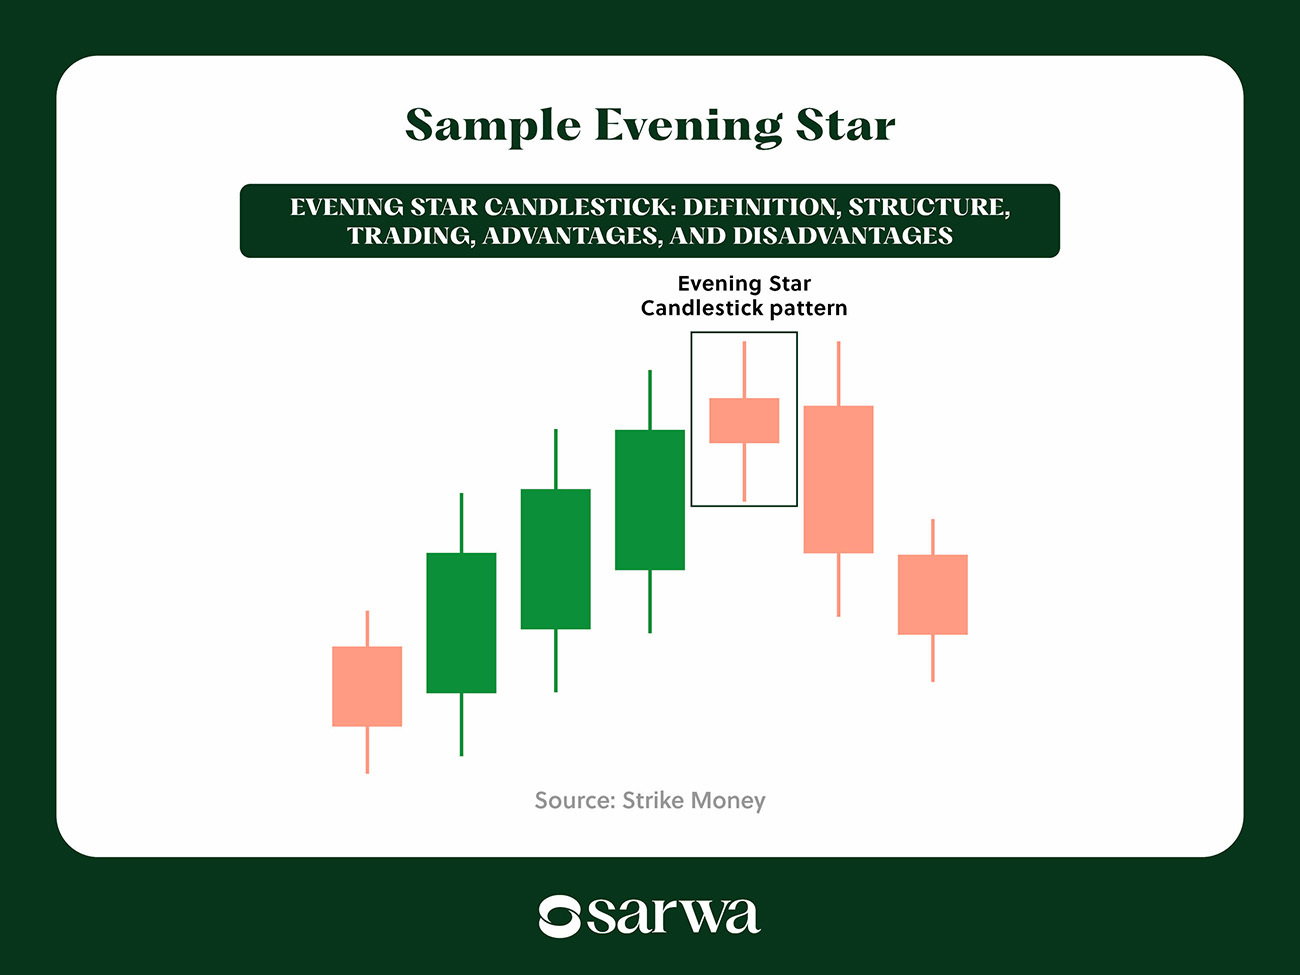
Source: Strike Money
Interpretation
The indecision candle shows that there is a weakness among the buyers, while the big bearish candle that follows indicates a bearish reversal.
17. Bullish Mat
Overview
The Bullish Mat Candlestick Pattern is a five-candle continuation pattern that appears in an uptrend. It starts with a strong bullish candle that is followed by three smaller bearish candles. The fifth candle is another strong bullish candle that closes above the high of the last bearish candle.
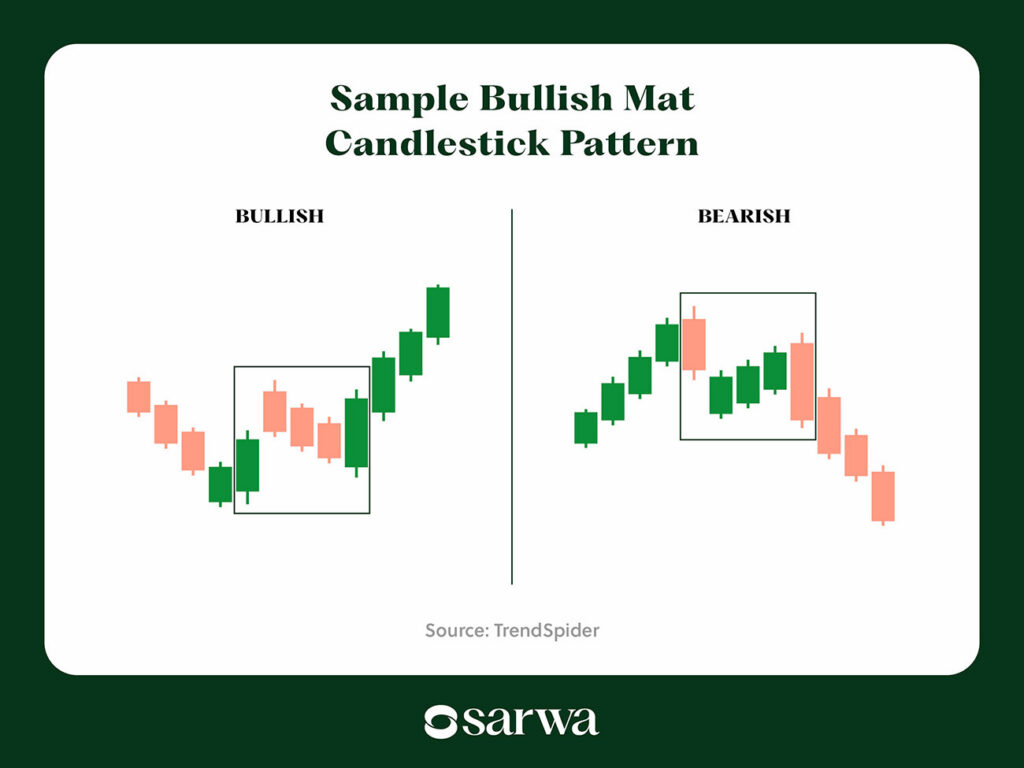
Source: TrendSpider
Interpretation
This pattern shows that buyers are only taking a brief pause (some profit taking, represented by the three small bearish candles) and that the bullish trend will continue.
18. Bearish Mat
Overview
The Bearish Mat Candlestick Pattern is the mirror image of the Bullish Mat. Here, the first candle is bearish, and it is followed by three small bullish candles. The final candle is big and bearish and closes above the high of the last bullish candle.
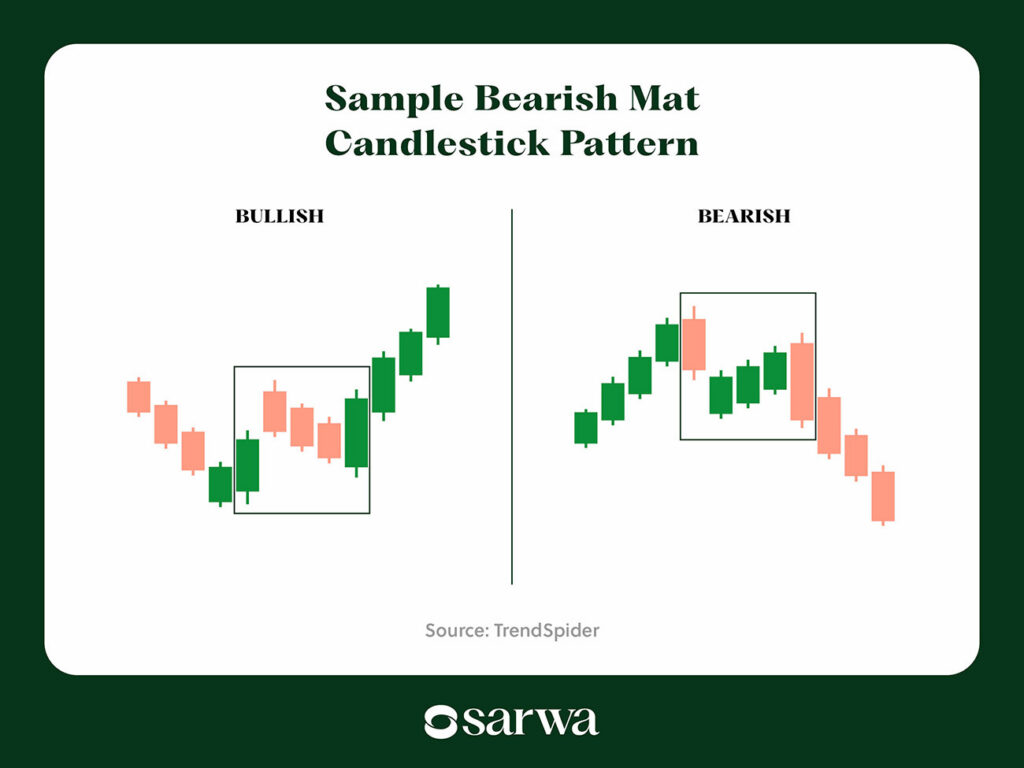
Source: TrendSpider
Interpretation
The bullish candles only show a brief consolidation or pause in selling pressure. As the buying pressure eases, the bears come back to dominate the market.
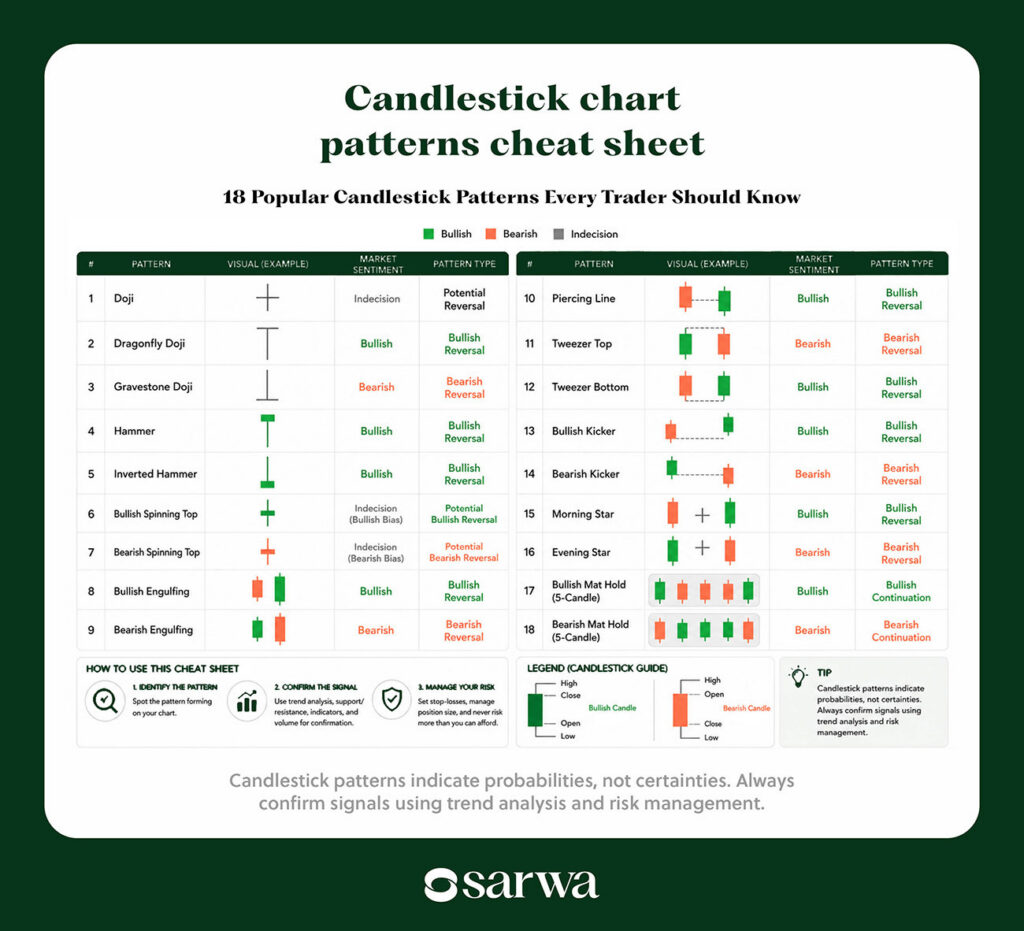
Other worthy mentions: Three Black Crows, Three White Soldiers, Bullish Marubozu, Bearish Marubozu, Dark Cloud Cover, Bullish Harami, Bearish Harami, Rising Three Methods, and Falling Three Methods.
5. How to use candlestick chart patterns
Now that you know 18 of the popular candlestick chart patterns, let’s consider some top tips for using them as a part of your technical analysis.
- Wait for confirmation, especially when dealing with trend reversals: When you see a bullish or bearish reversal pattern, wait for the next candle to confirm that there is indeed a new trend in the opposite direction.
For example, seeing a Dragonfly Doji after a Bullish Engulfing gives you greater confidence that there is indeed a bullish reversal.
- Understand the broad market direction: As we have seen multiple times, candlestick patterns are often useful depending on where they occur on the price chart.
For example, a Gravestone Doji makes sense as a bearish reversal pattern when it occurs at the end of a bullish trend. This implies that you must be aware of the current market trend (using moving averages and trendlines, for example) before you can decide how useful the candlestick pattern is.
- Seek additional context: Candlestick chart patterns also make more sense when they occur in areas of value like support and resistance levels, and where there is strong volume.
“A candlestick pattern can tell you how buyers and sellers are reacting in a specific time frame, but it does not offer a consistent advantage unless you have the market context,” according to Des Cooney, a financial consultant at Axis Financial Consultants, a group of tax and pension professionals. “You should use candlestick patterns to confirm your ideas, what you think is going on, instead of creating them. That is to say, trend analysis, support and resistance levels, and market structure can show you the direction of the market before the candlestick pattern shows up. Then you can decide when to enter or exit based on timing.”

- Use multiple timeframes: It is also helpful to validate your signals across different chart intervals. A bullish reversal on a 15-min chart might be noise, but when it is confirmed on the daily chart, you can be more confident that the buyers are truly ready to take over.
- Combine candlestick chart patterns with price chart patterns and indicators: In addition to waiting for a candle to confirm a reversal, you can also rely on price chart patterns (double tops, double bottoms, ascending triangles, descending triangles, etc.) and top technical trading indicators like Bollinger Bands, RSI, and MACD, among others.
“Personally, I would employ candlestick patterns to spot the entry and exit points; however, I would never base any trade decisions solely on the candle itself,” said Deepak Shukla, the founder of Pearl Lemon Capital, a business and property financing company. “I consider candlestick patterns just as important as chart patterns, but they serve different purposes. Chart patterns help define the broader market structure, while candlesticks provide precise timing within that structure.”

- Don’t study too many candlestick chart patterns: Instead of trying to learn 50 or 60 patterns, it is better to master a few across each category. The more patterns you try to study, the more confused you can become, and the more likely you are to be subject to analysis paralysis.
“Another issue I find prevalent among traders is that they tend to study an excessive number of candle chart patterns,” said Kevin Marshall, a Certified Public Accountant and the founder of Amortization Calculator, a finance tool. “Concerning practical applicability, the benefit derived from studying 30 to 40 different types of formations may be minimal. As a rule, a small number of patterns typically prove to be significantly more valuable.”
- Don’t forget risk management: After understanding market sentiment and forecasting future movement with candlestick chart patterns (in addition to other technical analysis tools), you still need to execute sound risk management strategies.
This is because even the best technical analysts cannot rightly predict market movements all the time. “Candle patterns represent nothing more than observations of market participant behavior,” according to Marshall. “Each pattern describes what participants have recently done. It does not provide any assurances regarding what participants will do next.”
Risk management is how you ensure that this imperfection does not result in massive losses. So, use sound position sizing and set stop-loss and take-profit levels.
If you are a new trader in the UAE, you need a trading platform that makes it easy for you to access the financial markets. With Sarwa, you can trade stocks, ETFs, stock options, and cryptocurrencies on a simple, intuitive, and user-friendly platform.
Transfers between your local bank accounts and your brokerage account on Sarwa are free. We also support fast deposits as well as multiple order types, so you can quickly lock in your preferred prices.
We also use bank-level SSL security to protect your data and money. Furthermore, we provide you with regular educational resources that will help you gain a better mastery of the financial markets.
Are you ready to start trading in the UAE? Sign up now for a Sarwa account for cost-effective, seamless, and secure access to the financial markets.
Takeaways
- Candlestick patterns help traders interpret market sentiment. They reveal the ongoing battle between buyers and sellers and can provide clues about potential price direction.
- The most reliable signals come when candlestick patterns are combined with trend analysis, support and resistance, indicators, and volume.
- A pattern’s meaning depends on where it appears within the broader market trend, making context just as important as the pattern itself.
- Even high-probability candlestick patterns can fail, making stop-losses, position sizing, and confirmation signals critical parts of any trading strategy.
Frequently Answered Questions
1. Are candlestick chart patterns reliable enough to trade on their own?
No. Candlestick patterns are most effective when used alongside other forms of technical analysis, such as trend direction, support and resistance levels, volume, and momentum indicators. Using multiple confirmation signals can help reduce false trading signals.
2. Which candlestick patterns are considered the most reliable?
There is no single ‘best’ candlestick pattern because their effectiveness depends on market conditions and context. However, patterns such as the Bullish Engulfing, Bearish Engulfing, Morning Star, Evening Star, and Hammer are among the most widely followed by technical traders because they often signal meaningful shifts in market sentiment.
3. Do candlestick patterns work in all financial markets?
Yes. Candlestick patterns can be applied to stocks, ETFs, forex, cryptocurrencies, commodities, and other tradable assets because they are based on price action rather than the underlying asset. However, their reliability can vary depending on factors such as market liquidity, volatility, and the timeframe being analyzed.