
The Relative Strength Index (RSI) indicator looks deceptively simple: a line moves between 0 and 100, and traders watch for readings above 70 (overbought) or below 30 (oversold).
But treating those numbers as automatic buy and sell signals is one of the easiest ways to misuse the indicator. A stock can remain “overbought” while continuing to climb, or stay “oversold” as its price keeps falling.
So, what does RSI actually tell you? More importantly, how can you use it without jumping into a trade too early?
In this guide, we’ll break down how the RSI indicator works, what overbought and oversold readings really mean, and how to combine RSI with price trends, moving averages, and other technical indicators to build a stronger trading setup.
We’ll cover:
- RSI definition: What the indicator means
- RSI strategy: How to use the RSI indicator
- RSI settings: How to get the best value from the RSI indicator
- RSI traps: Mistakes to avoid when using the RSI indicator
Do you want to learn more about the trading opportunities available in global financial markets? Subscribe now to Sarwa’s Fully Invested Newsletter for expert analysis you can trust.
1. RSI definition: What the indicator means
The RSI is one of the most popular technical indicators among traders. It is a momentum oscillator that measures the speed and magnitude of recent price movements.
It was developed in 1978 by J. Welles Wilder Jr, in his book New Concepts in Technical Trading Systems.
Traders use the indicator as both a momentum and reversal indicator. That is, the strength of recent price changes tells us about the momentum of the asset as well as potential reversal points.
The RSI formula is given as:
RSI = 100 – 100/(1+RS), where RS = Relative Strength = Average gain/average loss.
As this formula shows, the RSI compares the strength of an asset when closing prices are going up with when they are going down.
Also, the RS is usually calculated with a default look-back period of 14. As we get data for more trading periods, older periods fall off and newer periods are added. This makes the RSI a dynamic lagging indicator, reflecting the speed and magnitude of only the most recent periods.
As seen below, the indicator ranges from 0 to 100:
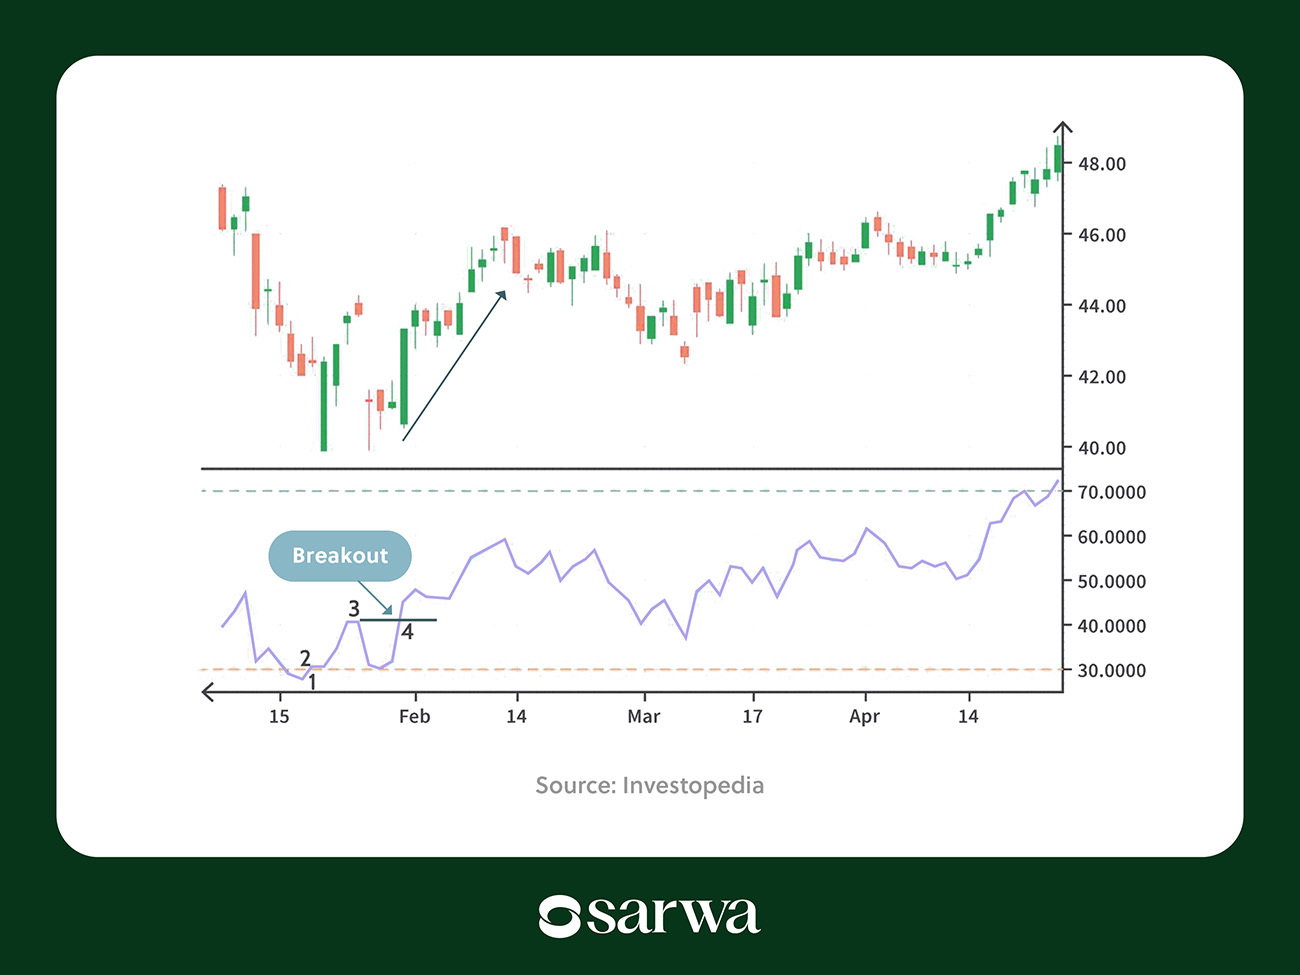
When average gains are much larger than average losses, the RSI approaches 100, signalling strong upward price momentum. Also, when average losses are much larger than average gains, it approaches 0, signalling downward price momentum.
We saw above that the RSI is both a momentum and reversal indicator. Those who use it for the latter tend to focus on the 70 and 30 levels. When it crosses above 70, they believe the asset is now overbought and probably due for a reversal to the downside. Similarly, when it crosses below 30, they interpret the asset as oversold and likely due for a reversal to the upside.
2. RSI strategy: How to use the RSI indicator
Below are some of the popular RSI strategies:
Identifying overbought and oversold conditions
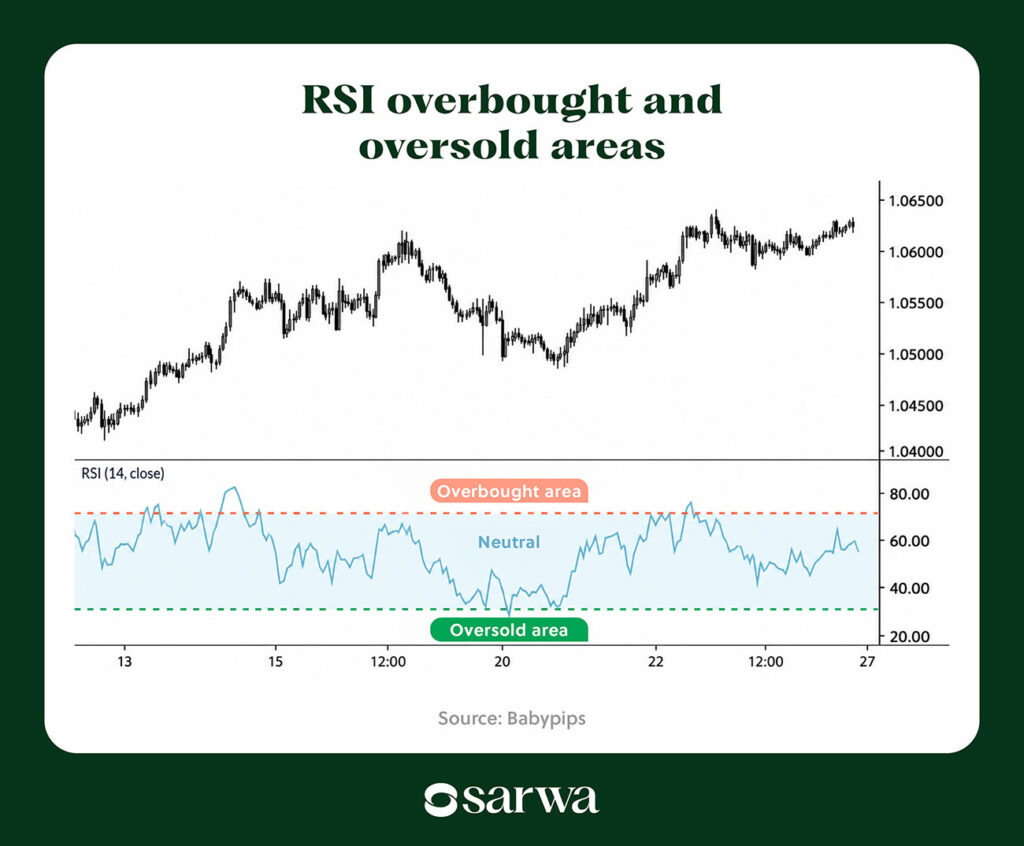
As the chart below shows, the RSI overbought area is where the indicator rises above 70, while the oversold area is where it falls below 30.
Source: Babypips
Instead of using fixed levels (70 and 30), which are often more appropriate in range-bound markets rather than trending markets, some traders determine the cutoff point dynamically based on historical prices and market conditions.
For example, in a bullish market, some traders adjust the cut-off points to 80 and 40 to reflect the fact that prices do stay elevated in bullish conditions. On the other hand, they can lower the thresholds to 60 and 20 in bearish markets.
Some traders use volatility rather than market trend as the basis for adjusting the cutoff points. For example, they widen the band when volatility is high (using an indicator like the Average True Range) and tighten it in range-bound markets where volatility is low.
Another strategy common among experienced traders is to determine overbought and oversold levels by looking at the RSI percentiles over a given period. For example, they might consider the asset overbought if RSI is in the top 10% of historical readings, irrespective of whether it is currently 70 or 80.
The main downside of this overbought/oversold strategy is that the RSI can stay in overbought or oversold conditions for a long time, especially when bullish or bearish momentum is strong. Consequently, the expected reversal might not come immediately, leading to failed trades.
“I’ve observed that relying solely on RSI often leads to missed opportunities,” according to Corina Tham, director of Business Development at CheapForexVPS, a company providing VPS solutions for forex traders. “For instance, while RSI is effective for identifying overbought or oversold conditions, its predictive power drops significantly in trending markets. Pairing RSI with complementary tools like moving averages or MACD can help refine trade entries and exits, especially in volatile forex pairs such as EUR/USD.”

RSI as trend confirmation
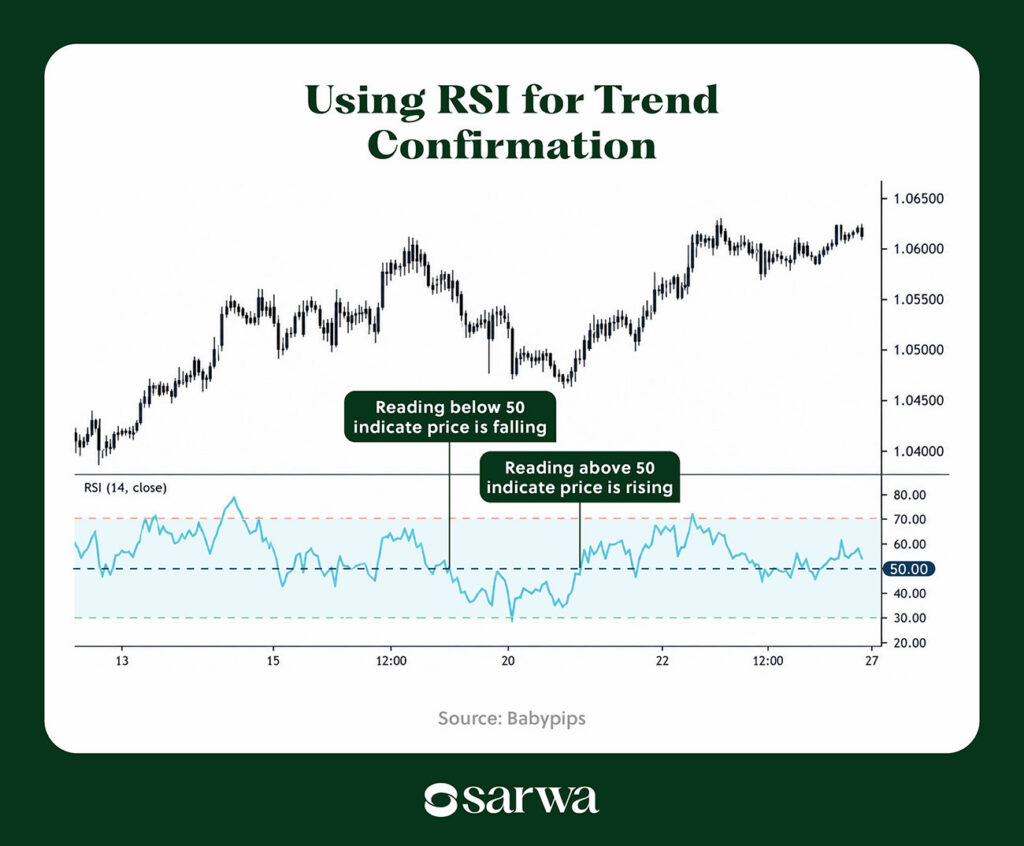
Many traders also use the RSI to confirm the current market trend. As seen below, bullish momentum is said to be stronger when the RSI crosses above 50, while bearish momentum is stronger when the RSI crosses below 50.
Source: Babypips
The important note about using RSI for trend confirmation is that the interpretation must align with the price trend. The RSI trading above 50 confirms a stronger uptrend only if the market is clearly in an uptrend, and vice versa.
Similarly, Andrew Cardwell expanded on Wilder’s ideas to introduce the concept of RSI range shifts. For him, the RSI oscillates between 40 and 80 in an uptrend and between 20 and 60 in a downtrend. A trend change has occurred when it transitions from one range to another.
RSI divergence
The RSI divergence works similarly to the MACD divergence.
It occurs when the RSI reads differently from the price chart. For example, the RSI may be making a higher low while price is making a lower low.
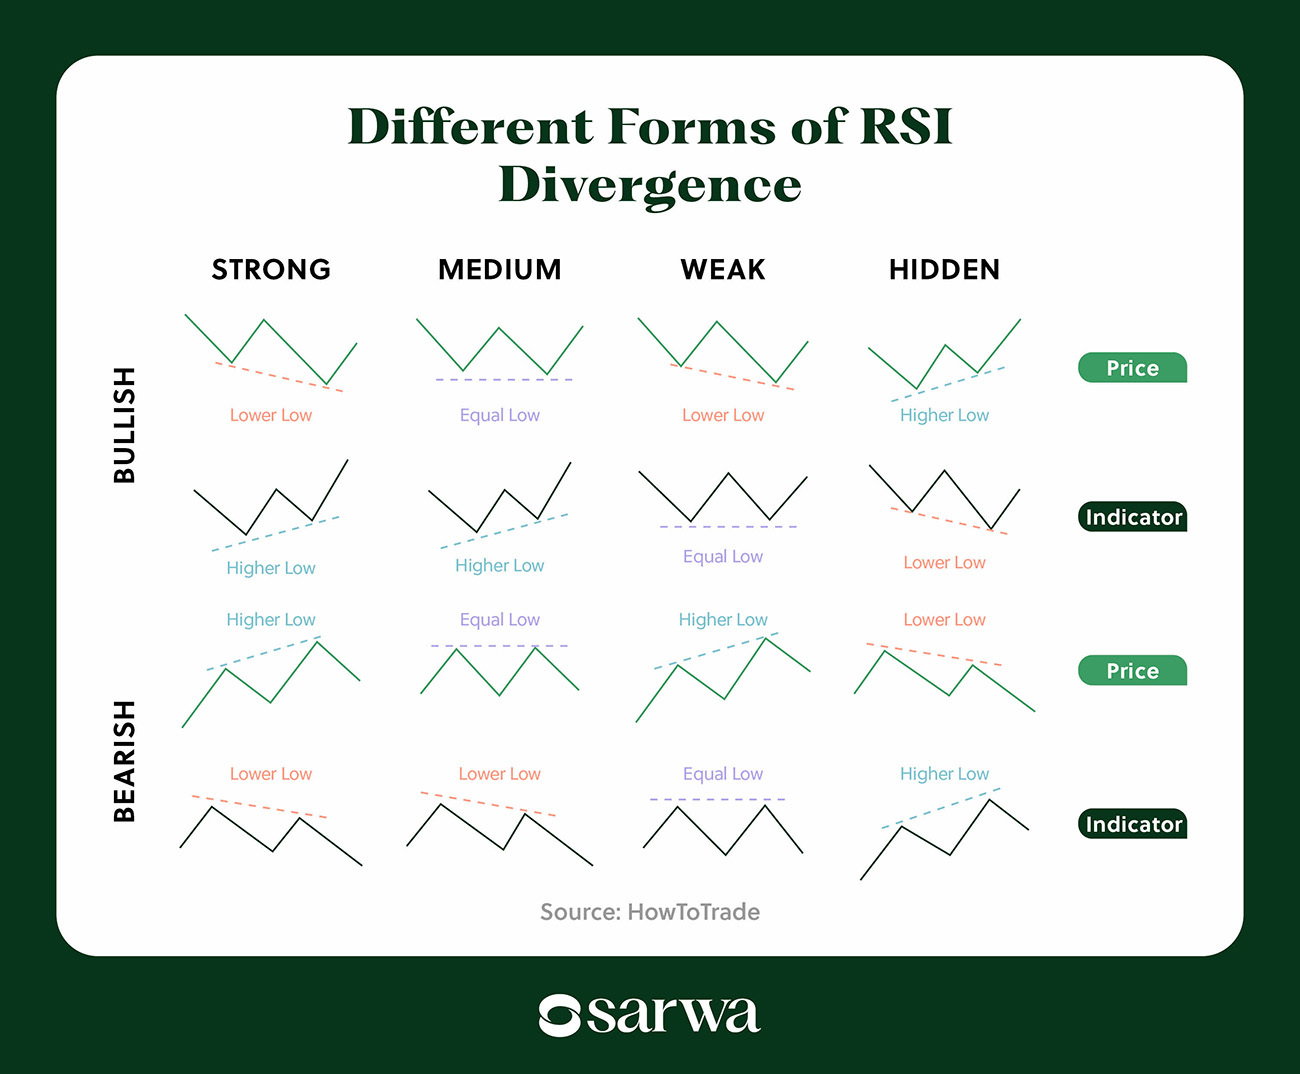
Below are the different types of RSI divergences:
Source: HowToTrade
At the heart of the RSI divergence strategy is the belief that bullish and bearish divergences often precede major turning points in trends. Mostly, when a divergence occurs, it is price that plays catch-up to the RSI.
Take the strong or regular bullish divergence as an example. The RSI is already showing higher lows while the price chart is still reading lower lows. Traders expect that the price chart will catch up, leading to a bullish reversal in the direction of the RSI.
This principle applies to strong, medium, and weak divergences.
The only exceptions are hidden bullish divergences and hidden bearish divergences. These are seen as continuation rather than reversal signals. In other words, instead of price moving in the direction of the RSI, it continues its current bullish or bearish trend. In other words, there is a weakness in momentum that makes a trend reversal impossible.
Positive and negative reversals
Cardwell also interpreted RSI as continuation signals in a manner similar to hidden bullish and bearish divergences.
Positive reversal occurs when RSI makes a lower low while price makes a higher low. In this situation, price continues to trend to the upside.
On the other hand, a negative reversal occurs when RSI makes a higher high while price makes a lower high, confirming the strength of the downward momentum.
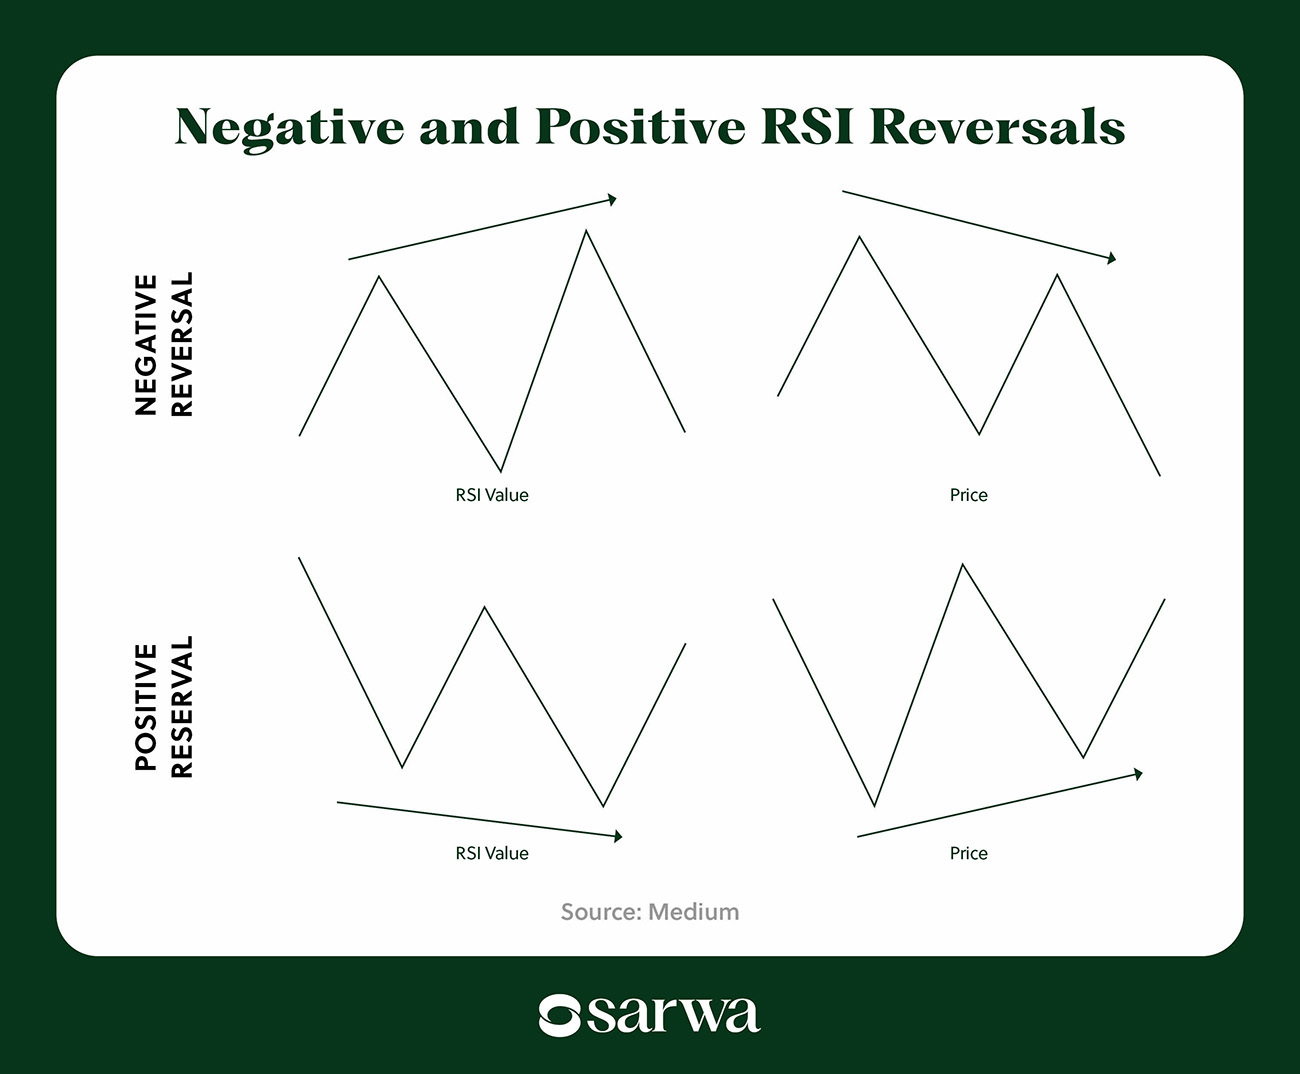
Source: Medium
RSI swing rejections
This is a strategy that was introduced by Wilder himself.
An RSI swing rejection (also known as RSI failure swing) can be bullish or bearish. In the bullish scenario, the RSI drops below 30, rises above it, dips but stays above 30, then breaks its previous high for momentum to the upside.
In the bearish scenario, the RSI rises above 70, falls below it, then rises again but stays below 70 before going on to break its previous low for momentum to the downside.
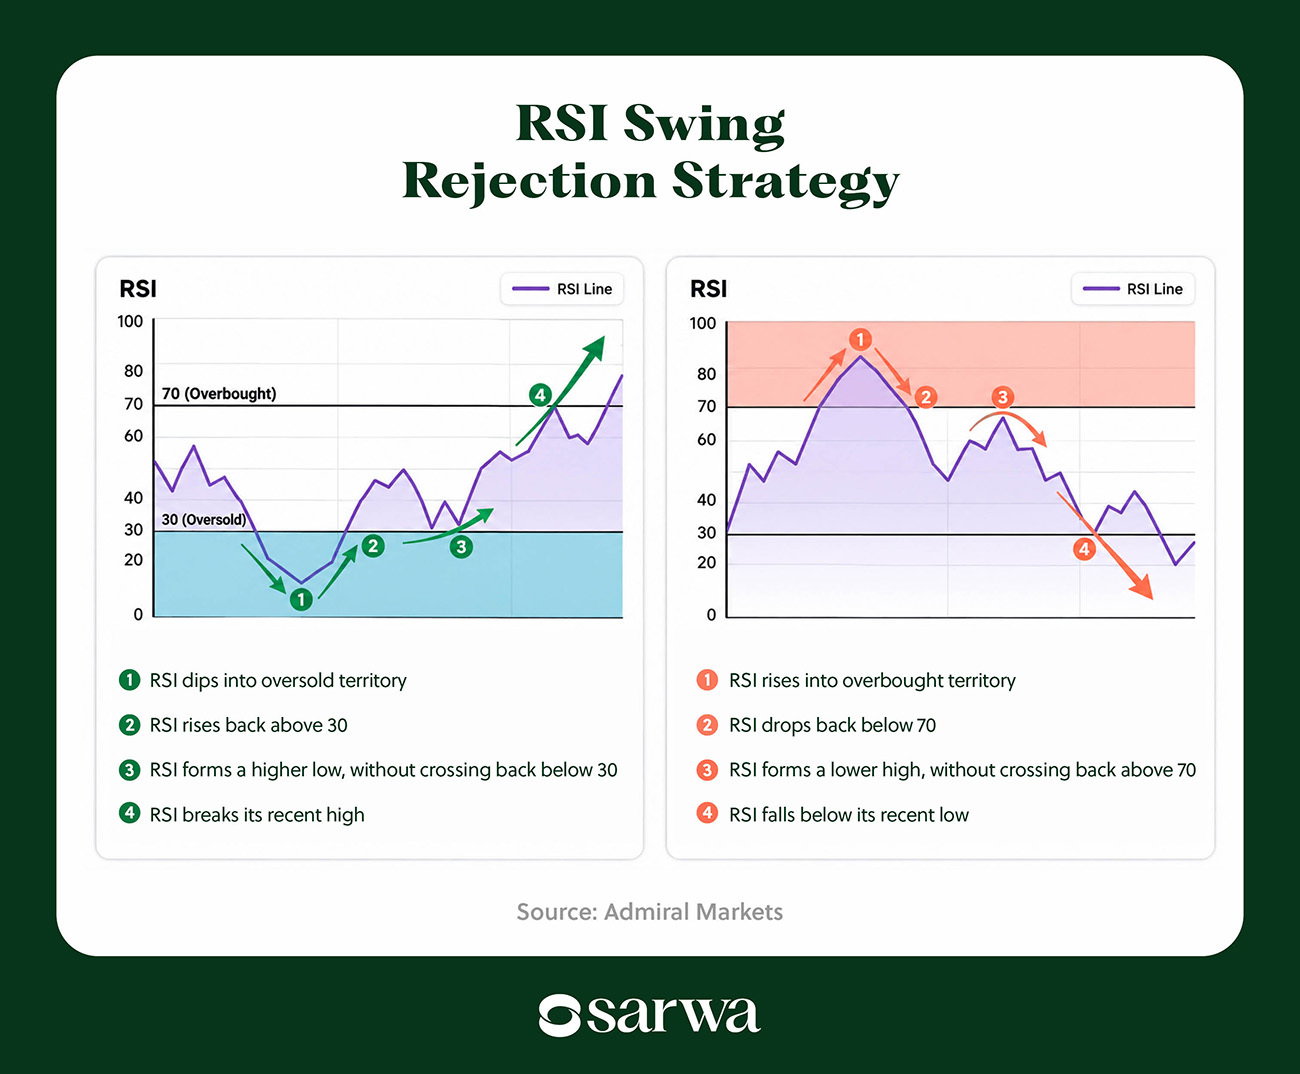
Source: Admiral Markets
RSI breakout strategy
Some traders also draw trendlines on the RSI indicator and interpret them similarly to price charts.
Just like price charts, RSI oscillates, forming peaks and troughs. A break of the trendline connecting the higher highs (in an uptrend) or the higher lows (in a downtrend) can be a sign of weaker momentum and a consequent reversal.
Below is an example of an RSI indicator with trendlines and breakouts.
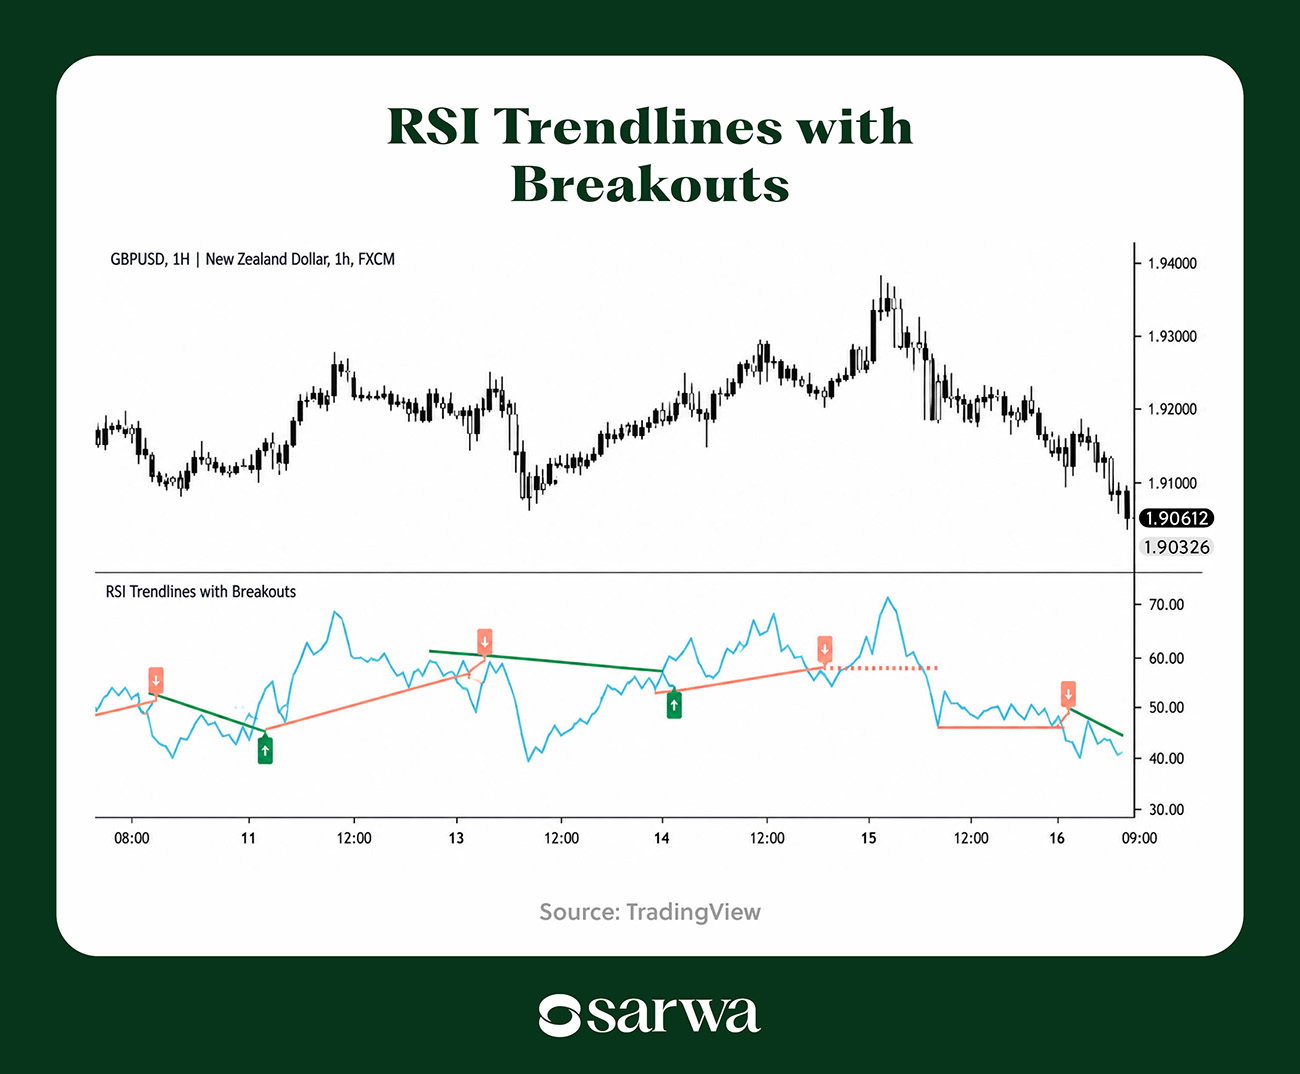
Source: TradingView
In this chart, there is a breakout of multiple trendlines leading to a trend reversal to both the upside and the downside.
3. RSI settings: How to get the best value from the RSI indicator
As noted above, the default RSI settings are for 14 periods with 70 and 30 marked out as the overbought and oversold thresholds.
However, given that there are different types of traders, some have found different RSI settings more amenable to their trading style and strategies.
For example, swing traders and position traders like the 14-period RSI because it provides reliable signals without overreacting to short-term moves.
However, day traders and scalpers, who work with short-term moves, often prefer shorter periods (5-9) that are more responsive and catch quick momentum shifts. Connors RSI, a popular modification of the standard RSI, uses three periods to get even more short-term responsiveness.
In other words, the best RSI settings depend on your trading style.
On the other hand, some trend followers and long-term investors use 20-30 periods to filter out noise and get smoother momentum readings.
We have looked at the different ways traders adjust the RSI settings to go beyond the typical 70 and 30 thresholds. To reiterate, some adjust these thresholds based on volatility, trend strength, and even the asset of interest (since volatility differs across assets). And some use a more dynamic strategy based on historical trends in RSI.
4. RSI traps: Mistakes to avoid when using the RSI indicator
When an indicator is as popular as the RSI, it is easy to misuse it, thinking it has the magical answer to all trading questions.
But as experienced traders know, no indicator solves all problems or answers all questions.
Below are some mistakes to avoid when using the RSI indicator:
- Using it independently of other patterns and indicators: Every RSI trading strategy can benefit from the use of other indicators as confirmation.
Instead of taking trades when the RSI reaches overbought or oversold conditions, experienced traders will confirm with candlestick chart patterns, price chart patterns, support and resistance zones in the price chart, or bollinger bands (resulting in the RSI+Bollinger Bands strategy).
Also, experienced traders will confirm trend direction with simple moving averages (SMA) or exponential moving averages (EMA) and trend momentum with other momentum indicators like the Stochastic Oscillator.
The possibility of a reversal when an RSI divergence occurs can also be confirmed with candlestick patterns, price chart patterns, or a Moving Average Convergence Divergence (MACD) crossover.
Similarly, breakouts from trendlines and swing rejections can be confirmed with volume indicators like the On-Balance Volume (OBV) or just a cursory look at the volume chart.
- Ignoring broader market trend: While the RSI can indicate trend momentum, it is crucial to first gain clarity about market direction. Strong momentum says nothing much unless we know whether we are in a bullish or bullish market.
Similarly, some traders overreact to every short-term trend (RSI crossing above or below 50) while ignoring broader market structure. But experienced traders know that the RSI can be noisy, especially on lower timeframes.
- Static thresholds: To reiterate, experienced traders don’t stick to the 70 and 30 thresholds, irrespective of market conditions. Instead, they adjust the thresholds to reflect volatility and momentum or implement a dynamic method that accounts for historical trends.
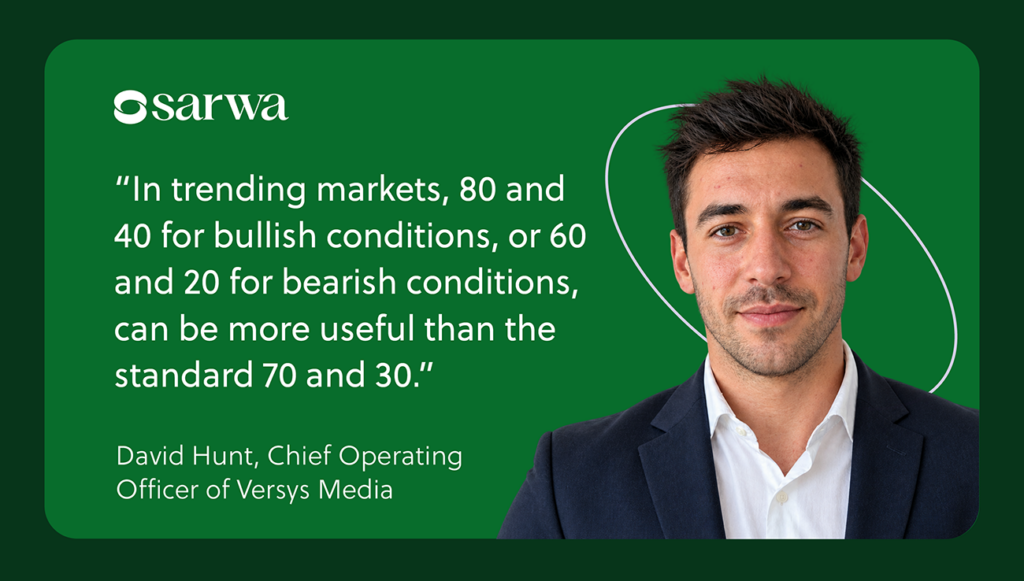
“In trending markets, 80 and 40 for bullish conditions, or 60 and 20 for bearish conditions, can be more useful than the standard 70 and 30,” according to David Hunt, a stock trader and Chief Operating Officer of Versys Media, a digital marketing agency. “That small change tends to stop premature entries and gives a better read on trend strength. Recently, that approach has worked better for me than trying to force reversal trades every time RSI reaches an extreme.”
- Failing to adjust RSI settings to trading style: While the default 14-period works well for swing trading and position trading, it can be ineffective for day trading or a scalping strategy. Adjusting the settings to reflect trading style is a pro move that beginners should emulate.
- Ignoring risk management: Even when using RSI with other indicators, experienced traders still employ sound risk management strategies like stop loss orders and position sizing.
- Ignoring artificial intelligence: Trading platforms like TradingView and TrendSpider now have tools that can help traders automatically detect patterns on their trading charts. Experienced traders are learning how to use AI to trade stocks and other assets with tools like these.
By quickly identifying patterns on the price charts, traders can make more informed decisions instead of acting only on RSI signals.
Creating a sound trading strategy is one side of the equation. The other side is having a trading platform that helps you effectively execute your strategy.
With Sarwa Trade, you can trade stocks, ETFs, stock options, and cryptocurrencies in the UAE with the tools you need to succeed.
Transfers between Sarwa and your local bank accounts are free. You can also purchase fractions of a share of any asset available on Sarwa Trade.
Also, you can create both market and limit orders, which is crucial if your strategy requires entering and exiting at precise price points. Interestingly, you can get started on Sarwa Trade with just $500.
We provide personalized customer support, while also protecting your information with 256-bit encryption.
Are you ready to execute your RSI trading strategies? Sign up now for Sarwa Trade for seamless trading in the UAE.
Takeaways
- RSI is a momentum tool, not an automatic buy-or-sell signal. Readings above 70 or below 30 can indicate overbought or oversold conditions, but prices can remain in these zones during strong trends.
- Moving averages, MACD, candlestick patterns, support and resistance, and volume can help confirm potential RSI signals.
- The default 14-period RSI may suit swing and position traders, while shorter settings can provide more responsive signals for day traders and scalpers.
- AI-powered tools can help identify chart patterns and combine them with RSI and other metrics, potentially giving traders more context before acting on a signal.
Frequently Answered Questions
1. What is a good RSI for buying?
An RSI below 30 is traditionally considered oversold, which some traders interpret as a potential buying opportunity. However, an oversold reading does not guarantee that a stock will rebound. Prices can continue falling while RSI remains below 30.
For this reason, traders often look for confirmation from the broader price trend, support levels, candlestick patterns, moving averages, or other momentum indicators before entering a trade.
2. Is an RSI above 70 a sell signal?
Not necessarily. An RSI above 70 generally indicates that an asset is overbought, but it does not mean the price must immediately reverse. Strong bullish trends can keep RSI above 70 for an extended period.
Rather than selling solely because RSI crosses 70, traders can look for additional confirmation, such as bearish RSI divergence, a change in price structure, a MACD crossover, or a break below a support level.
3. What is the best RSI setting for trading?
The 14-period RSI is the standard setting and can work well for swing and position traders because it provides a balance between responsiveness and filtering out short-term market noise.
Day traders and scalpers may prefer shorter settings, such as 5–9 periods, because they react more quickly to price changes. Longer-term traders may use 20–30 periods to produce smoother readings and reduce short-term noise. The best setting ultimately depends on your trading timeframe and strategy.
4. Can RSI be used on its own to make trading decisions?
It’s generally better not to rely on RSI alone. While RSI can help identify momentum, overbought and oversold conditions, and potential divergences, it does not provide the full picture of an asset’s price action.
Traders can combine RSI with tools such as moving averages, MACD, support and resistance levels, candlestick patterns, and volume indicators to confirm potential signals. AI-powered chart analysis tools can also help identify patterns alongside RSI and other technical metrics, giving traders additional context before making a decision.