
Every trading chart tells a story, but only a few price levels matter enough to influence how that story unfolds.
Markets rarely move in a straight line. Instead, they pause, reverse, or accelerate around specific zones where buyers and sellers battle for control. These areas, known as support and resistance levels, have become one of the most widely used tools in technical analysis because they help traders identify where opportunities and risks are most likely to emerge.
Whether you’re looking to buy a breakout, sell into weakness, or simply avoid entering a trade at the worst possible moment, understanding the support and resistance indicator can dramatically improve your timing.
In this guide, we’ll explain what support and resistance levels are, how to draw them, and the popular support and resistance strategies you can consider in your trading. We’ll cover:
- What are support and resistance levels?
- How to draw support and resistance lines
- Support and resistance indicators: How to get more accurate levels
- Support and resistance trading: The most popular strategies
Do you want to learn more about how to identify opportunities in global financial markets? Subscribe now to Sarwa’s Fully Invested newsletter for expert insights on the global economy.
1. What are support and resistance levels?
Support and resistance levels are fundamental concepts in technical analysis because they help traders identify potential turning points in price movements. They are popular in forex, stock, ETF, cryptocurrency, and commodity markets.
Let’s take them one at a time.
Support levels
A support level is a price point where a downward trend tends to pause, as buying pressure increases to mitigate the selling pressure. In other words, it is a point or zone where buyers step in to prevent further price decline.
There are three ways to picture a support level on a chart:
- Horizontal support levels: This is a fixed price level or zone where buyers repeatedly enter the market to prevent further declines.
Below is an example:
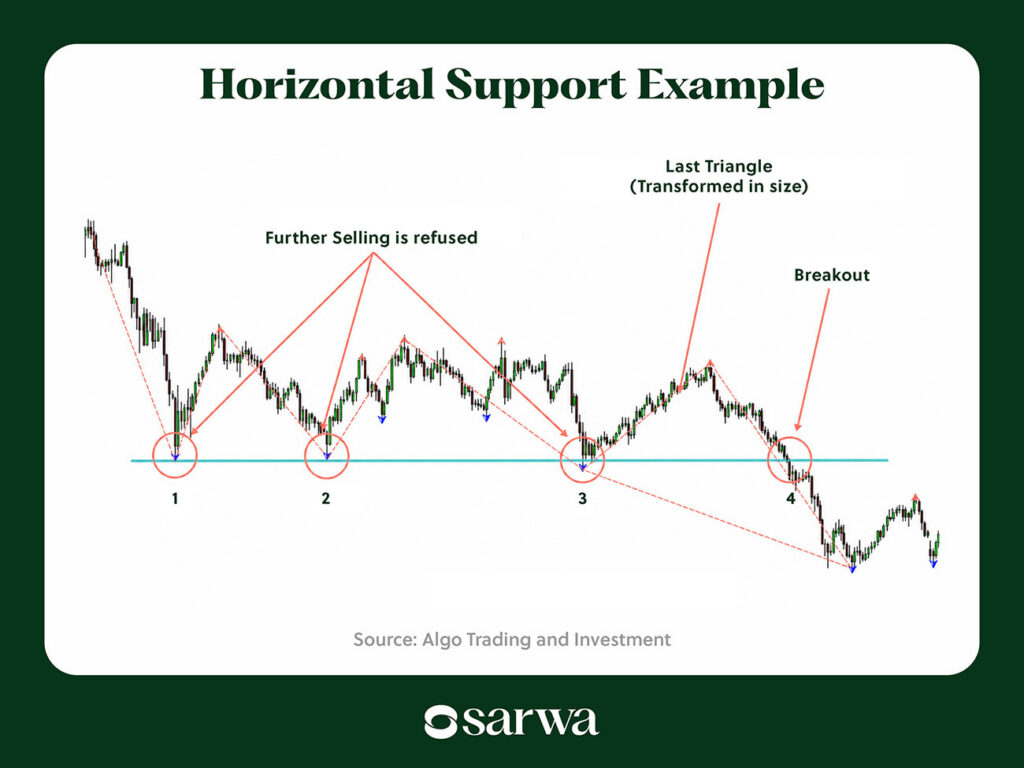
As seen in this chart, the downward trend reverses around the same price zone. This support level held up three different times, with buying pressure overtaking selling pressure, until it was broken through on the fourth attempt.
- Trendline support: The trendline is a diagonal line that connects a series of price points within a given trend. In an uptrend, price makes higher highs and higher lows; the trendline support is the diagonal line connecting the swing lows.
Below is an example of a trendline support:
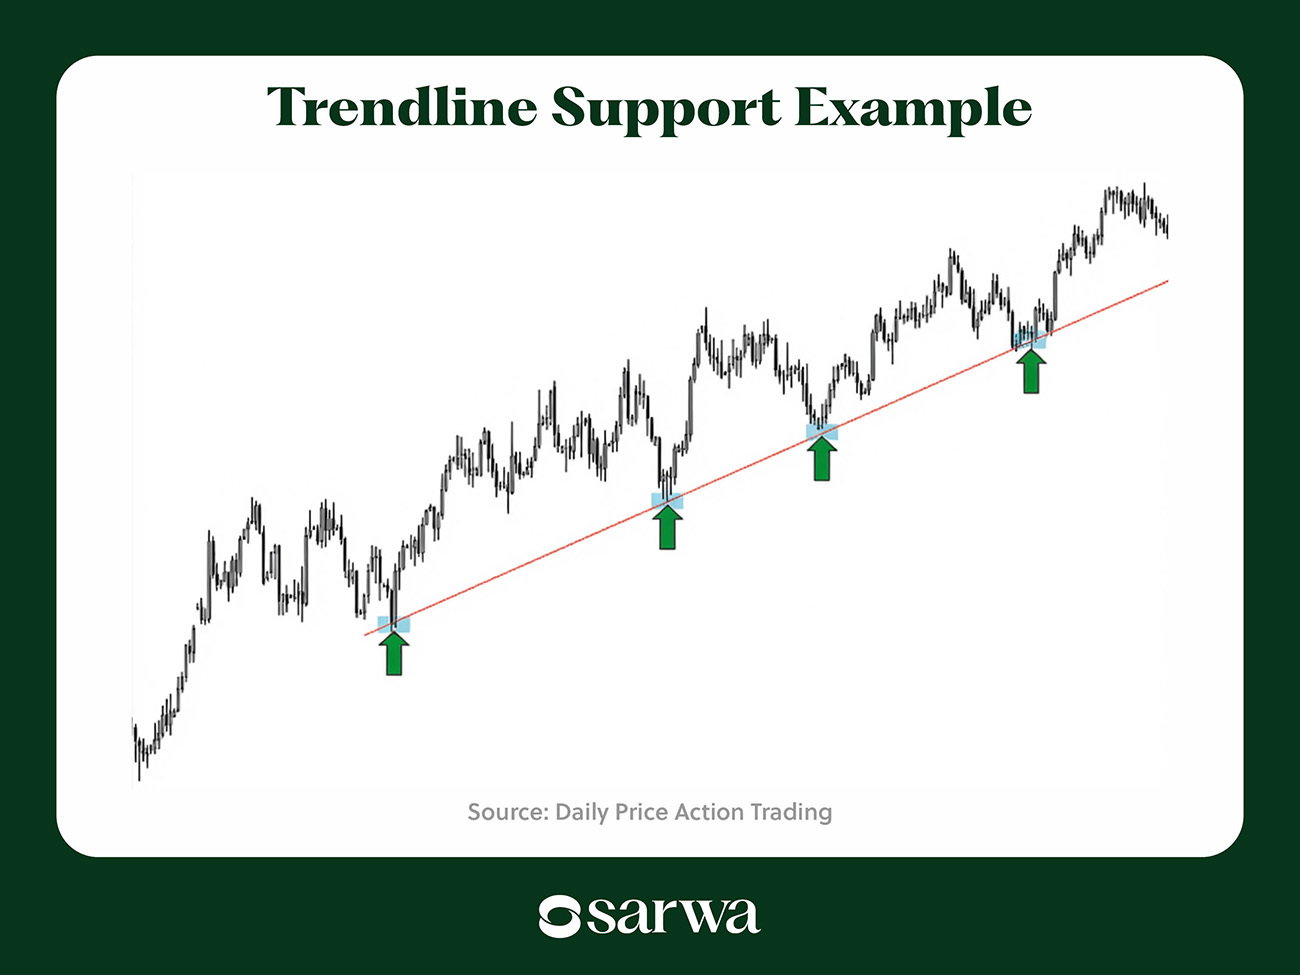
The trendline support is also called dynamic support because the turning point (where selling pressure is exhausted) is not fixed but moves up with the trend.
- Indicator-based support: Some top technical indicators can also serve as support zones. Traders often use them as confirmation of horizontal and trendline support levels. But more on this later.
Resistance levels
A resistance level is the opposite of the support level – it is the turning point where sellers come in to mitigate buying pressure and cause a pause on the current uptrend. In other words, it is the point or zone where buying pressure gets exhausted as selling pressure rises.
There are also three ways to picture resistance levels on a chart:
- Horizontal resistance levels: Here, there is a fixed price level or zone where sellers consistently come in to increase selling pressure and prevent any further upside.
Below is an example:
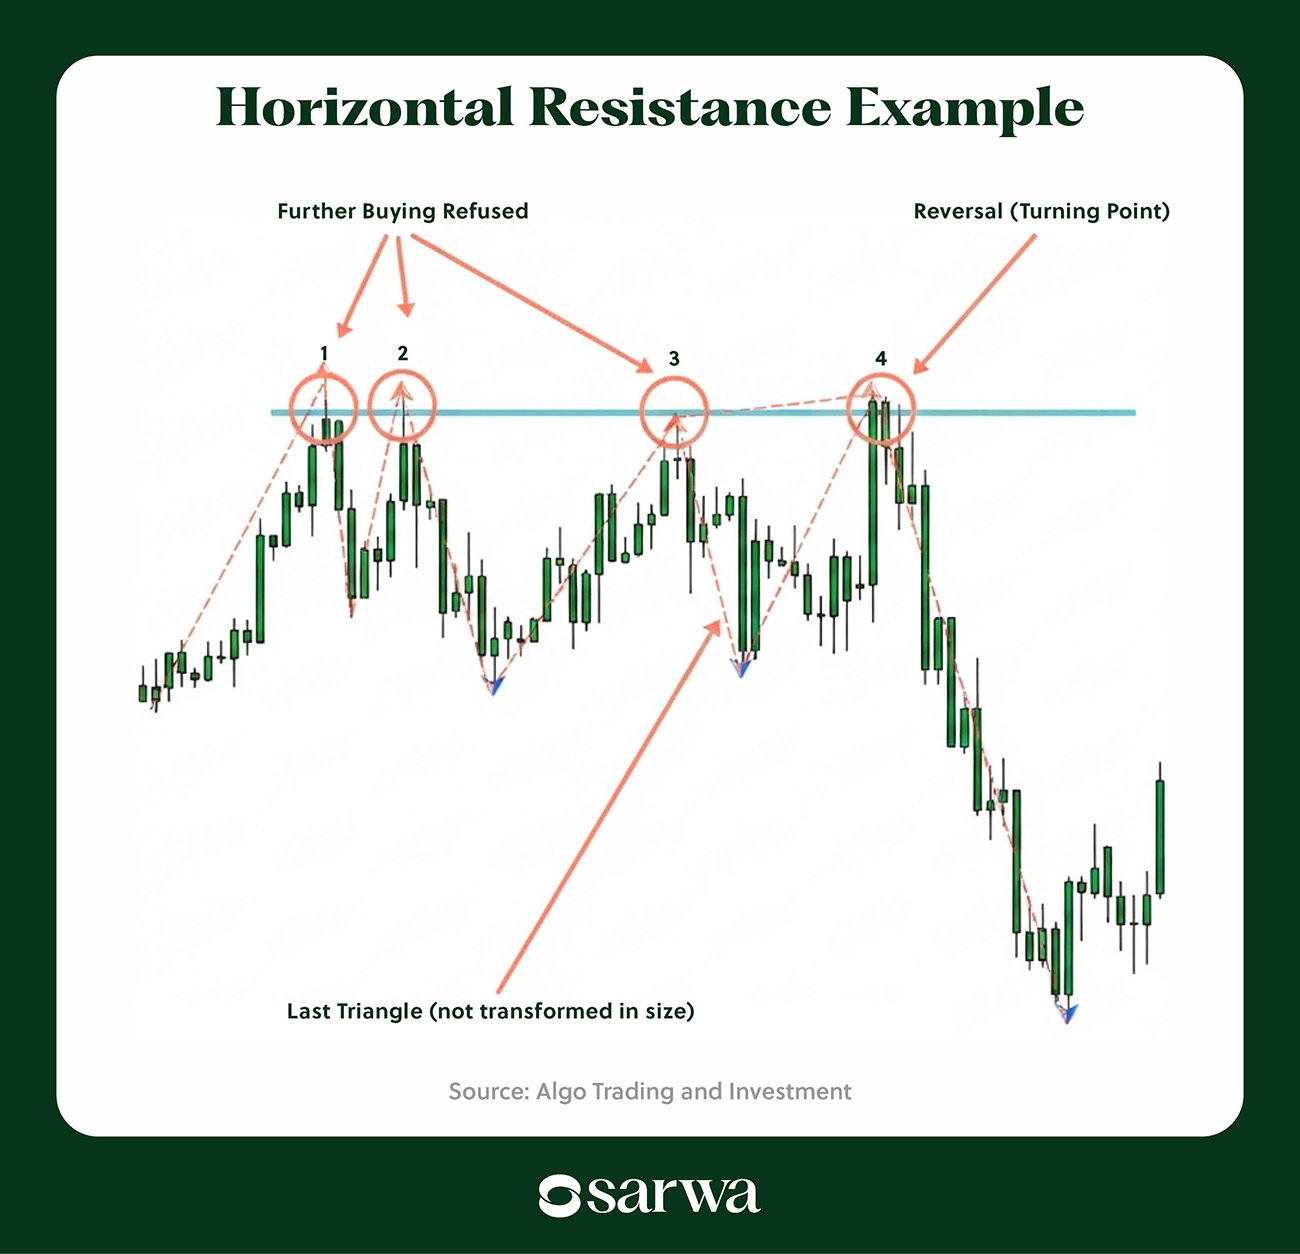
In this example, the uptrend pauses around the same price zone four different times, leading to a downtrend.
- Trendline resistance: In a downtrend, the market makes lower highs and lower lows; the trendline resistance line connects the swing highs.
Below is an example:
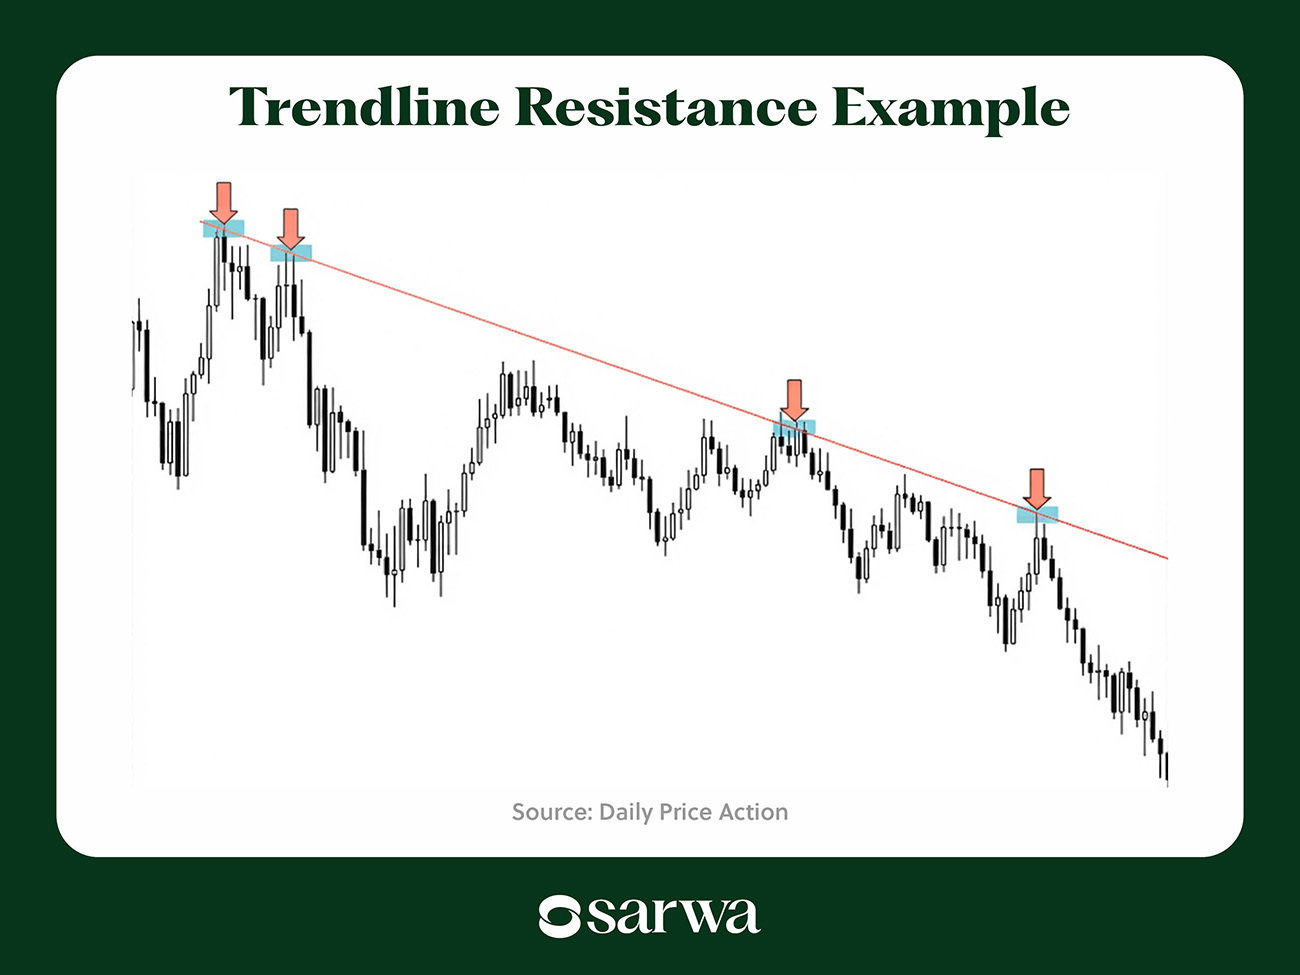
The trendline resistance is also known as dynamic resistance since the turning point shifts as the trend progresses.
- Indicator-based resistance: The same indicators that act as support zones also function as resistance zones. More on them later.
2. How to draw support and resistance lines
Drawing horizontal and trendline support and resistance lines is a crucial aspect of price action trading.
Since the mechanisms for both differ, we will consider the tips for drawing them independently.
How to draw horizontal support and resistance lines
Below are some tips for drawing horizontal support and resistance lines.
- Start with a higher timeframe: Higher timeframes (weekly, daily, or 4hrs, depending on your trading style) can help you to see the broader price structure. Also, they give you confidence that you have identified a solid market trend rather than temporary noise.
- Mark repeated reaction points: Once you are on a higher timeframe, draw horizontal lines at the lowest and highest points where price consistently reverses upward or downward.
- Confirm support and resistance lines with multiple touches: Many traders will look for at least 2 or 3 touches of the line before they can be sure they have found a turning point where price reacts from.
- Use zones instead of price points: Horizontal support and resistance levels are often price zones (with ranges) rather than specific price points.
Below is an example of what a zonal approach looks like:
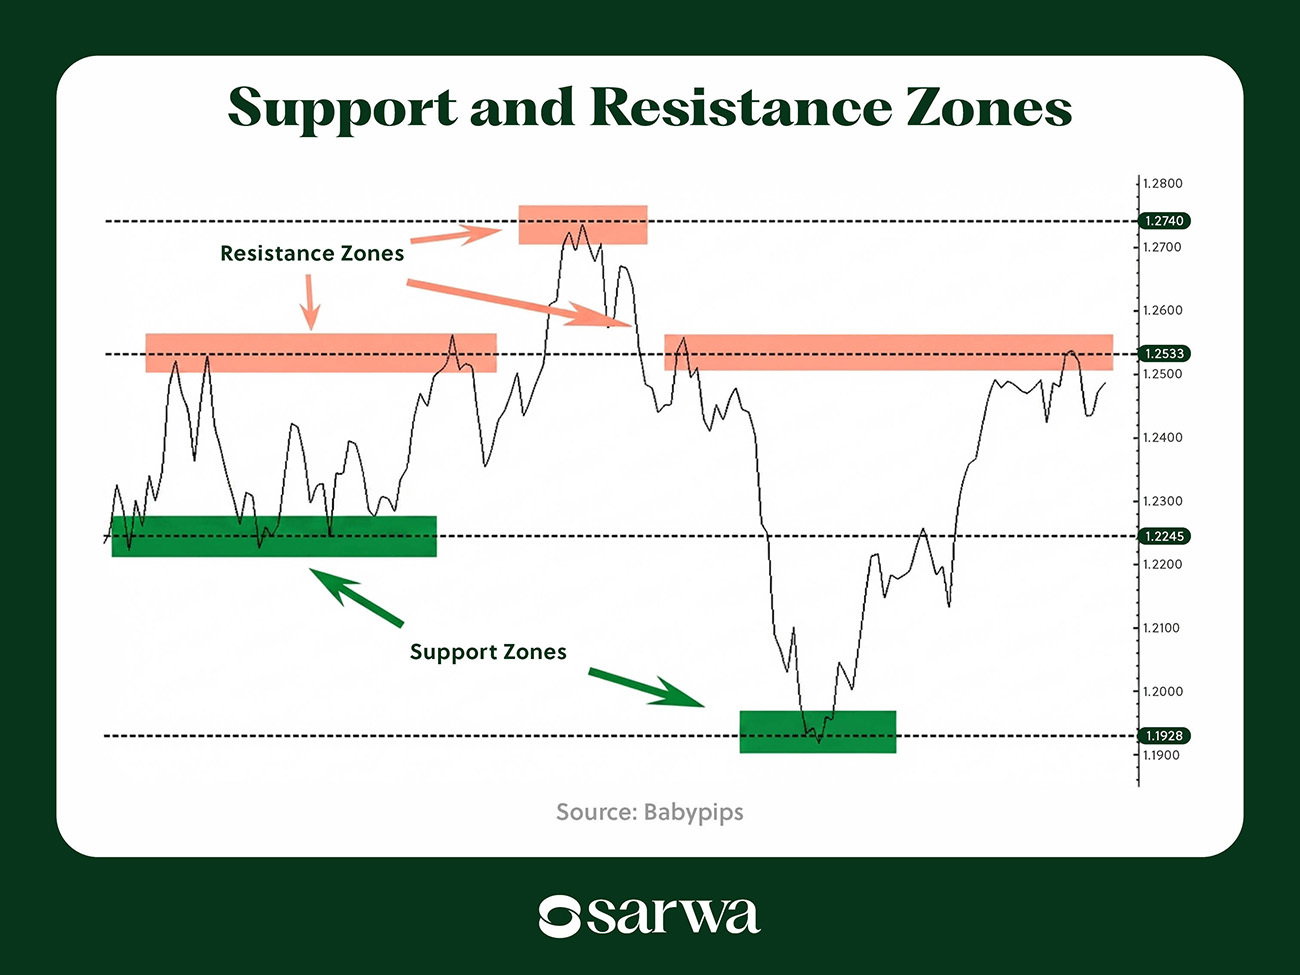
Consider the first support zone in the chart above.
If you use a specific price point, say 1.2245, then you might have thought price was about to break out from support when it went a little below this price point three different times.
However, a zonal approach would have protected you from treating these movements as breakouts since your support level ranges between two price points. Thus, any price level within that trading range would still be in support territory.
“Markets don’t trade to a precise number and reverse,” according to Ian Skjervem, the CEO of Smart Investors Daily, a financial market analysis platform. “They trade in an area of memory where buyers or sellers who acted at that level before are making decisions again. Drawing a single line suggests a level of accuracy that the market does not really have.”

- Use lower timeframes to find secondary levels: While higher timeframes can show the broader market structure, lower timeframes are best for precise entry and exit points, especially for scalping and day trading.
Therefore, after highlighting support and resistance zones on higher timeframes, follow the same process on lower timeframes.
How to draw support and resistance trendlines
Below are some tips for drawing dynamic support and resistance levels:
- Identify the overall trend: We are in an uptrend if prices are showing higher highs and higher lows, and a downtrend if they are showing lower highs and lower lows. Trend identification is basic because trendlines only make sense in trending markets (they are useless in consolidation or ranging markets).
- Connect the key swing points: The next step is to connect multiple higher lows (for support) or lower highs (for resistance) using the trendline tool. As with horizontal support and resistance levels, the more touches of the trendline, the better.
- Treat trendlines as zones: A zonal approach to trendlines can also help avoid false breakouts.
- Extend the trendline forward: Extending the trendline forward can help to identify potential entry and exit points. But more on that later.
Automating support and resistance levels recognition with AI
Many trading platforms are now utilizing artificial intelligence (AI) models to help traders automatically detect key price zones and chart patterns.
For example, TradingView’s Auto Chart Patterns and TrendSpider’s Automated Chart Pattern recognition can help you spot most of the popular chart patterns, including those that rely on support and resistance levels.
For example, they can identify a wedge or a triangle, which comprise support and resistance trendlines. In this way, you can identify key zones without drawing lines manually.
However, auto recognition of support and resistance levels often has a downside: they provide so many levels that you don’t know which one to focus on.
“I tried one tool that automatically plotted levels on all time frames and identified many more potential support and resistance levels than I could ever trade,” according to Ian. “The output was technically correct, but practically useless, since the usefulness of S&R analysis is not to find every level. It’s knowing which levels are relevant to the trade you’re considering.”
What did Ian conclude from this experience?
“Nothing I’ve tried has given me as good pattern recognition as manual identification does, since when you draw levels by hand you have to consider why they are important, not just that they are.”
In other words, AI should not be a replacement for human judgment about which levels are important, and which are distractions.
3. Support and resistance indicators: How to get more accurate levels
Support and resistance trendlines are essential components of many chart patterns and indicators.
We have seen how automatic chart pattern recognition tools can help to be more precise with support and resistance levels. Similarly, using support and resistance indicators can help to improve accuracy and remove guesswork.
Let’s review some of the most popular support and resistance indicators.
Moving averages
As the name indicates, the moving average is a constantly updated average price of an asset. It’s a good way to smooth out price data and focus on the ‘true’ trend over a given period.
There are two main types of moving averages: the simple moving average (SMA), which gives equal weight to all prices, and the exponential moving average (EMA), which gives more weight to recent prices.
When overlaid over a price chart, the moving average can act as either support or resistance, depending on the market’s trend.
Below is an example of a 50SMA acting as both support and resistance at different stages of the market:
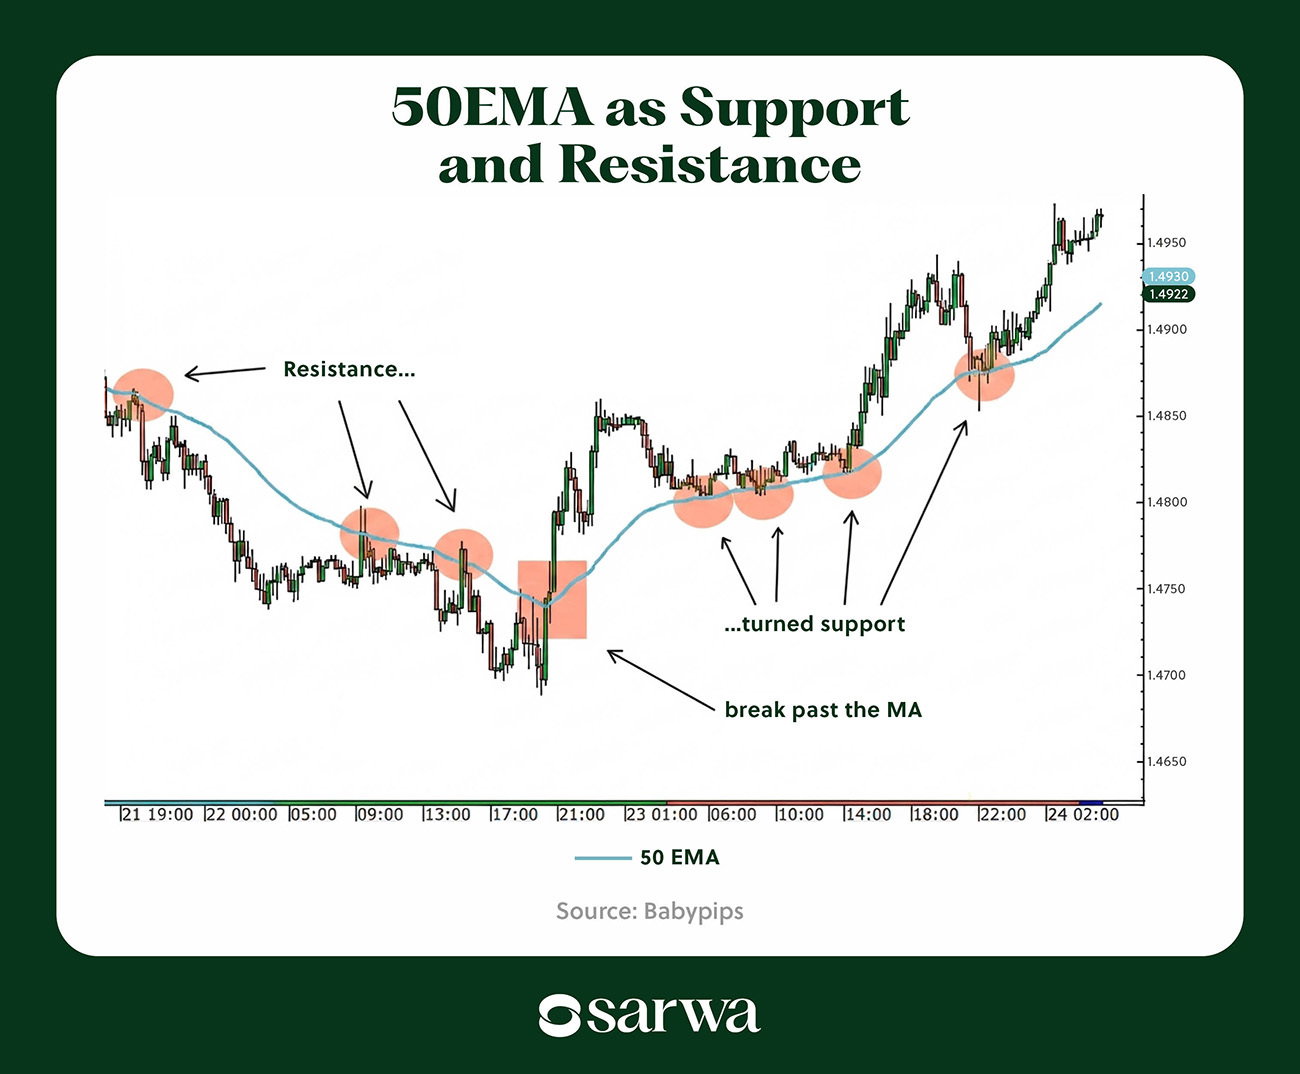
In popular usage, the 50SMA is used to identify medium-term trend (especially useful for swing trading), the 200SMA for long-term trend, and the 10-20EMA for short-term trend.
Fibonacci levels
Fibonacci levels are horizontal lines drawn at key retracement levels (23.6%, 38.2%, 50%, 61.8%, and 78.6%), based on mathematical ratios derived from the Fibonacci sequence.
These levels represent areas where price may pause, reverse, or consolidate after a strong trend, which is why they often coincide with support and resistance levels.
Below is an example of Fibonacci levels acting as key support and resistance levels:
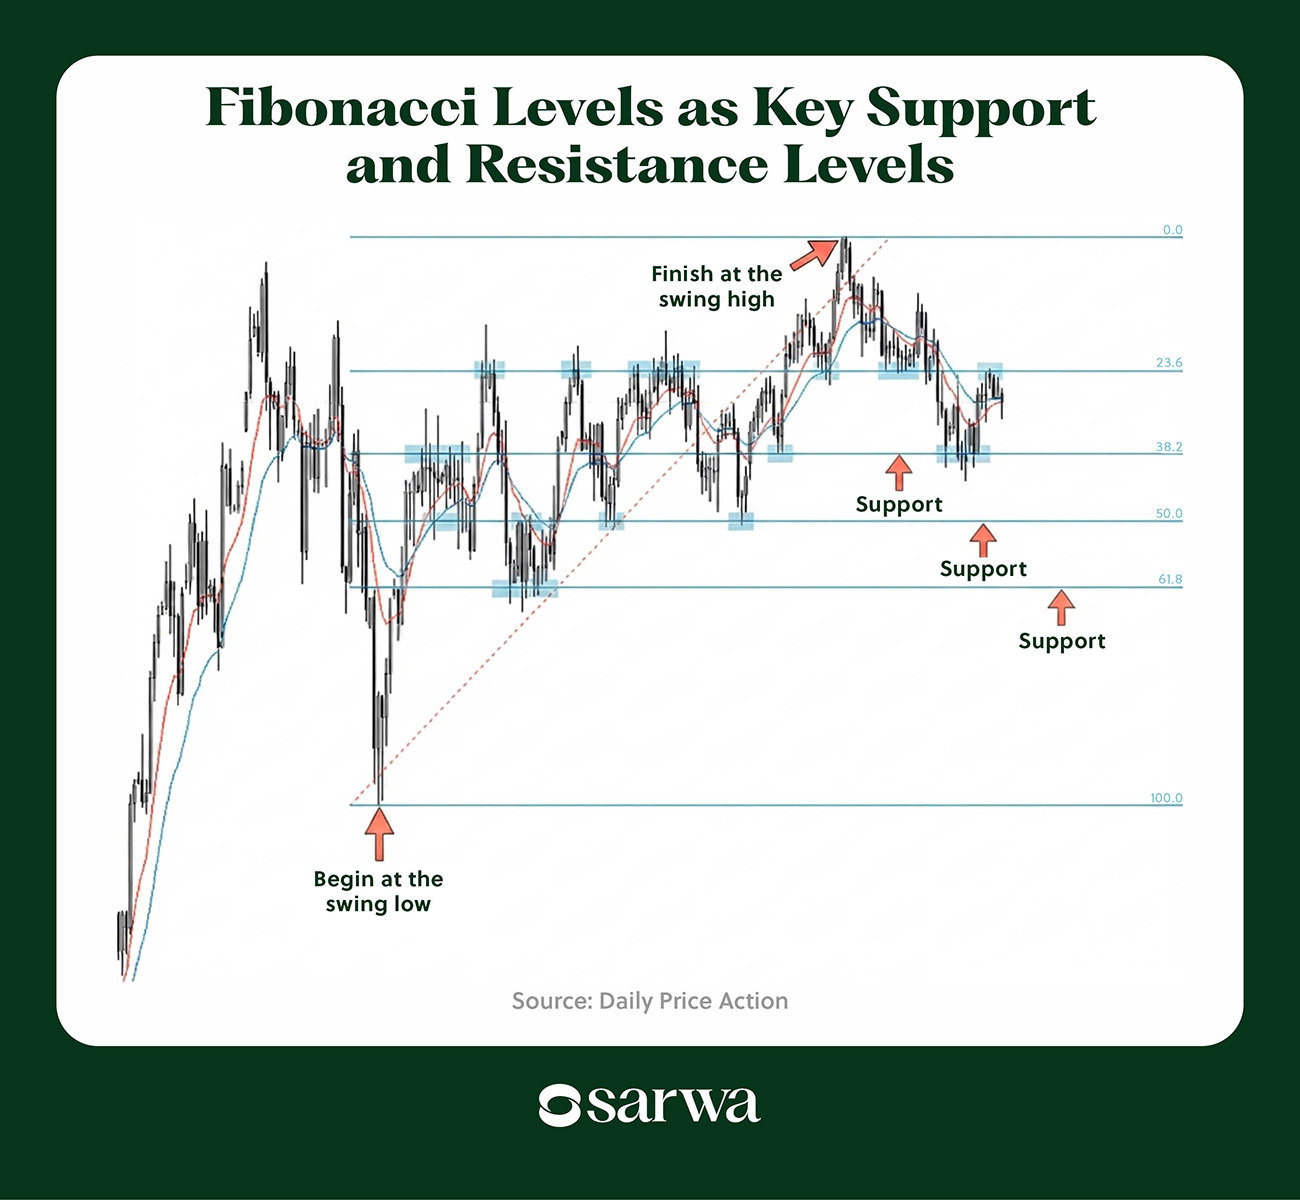
As seen in the chart above, there is strong support at the 50% level and strong resistance, turned support, at the 23.6% level.
Relative strength index (RSI)
The RSI is an indicator that measures the strength of recent price moves and helps identify both overbought and oversold conditions.
Some traders use the range boundaries of the RSI indicator as support and resistance levels. For example, there is usually support at the 30-35 level and resistance at the 70 level, as seen below:
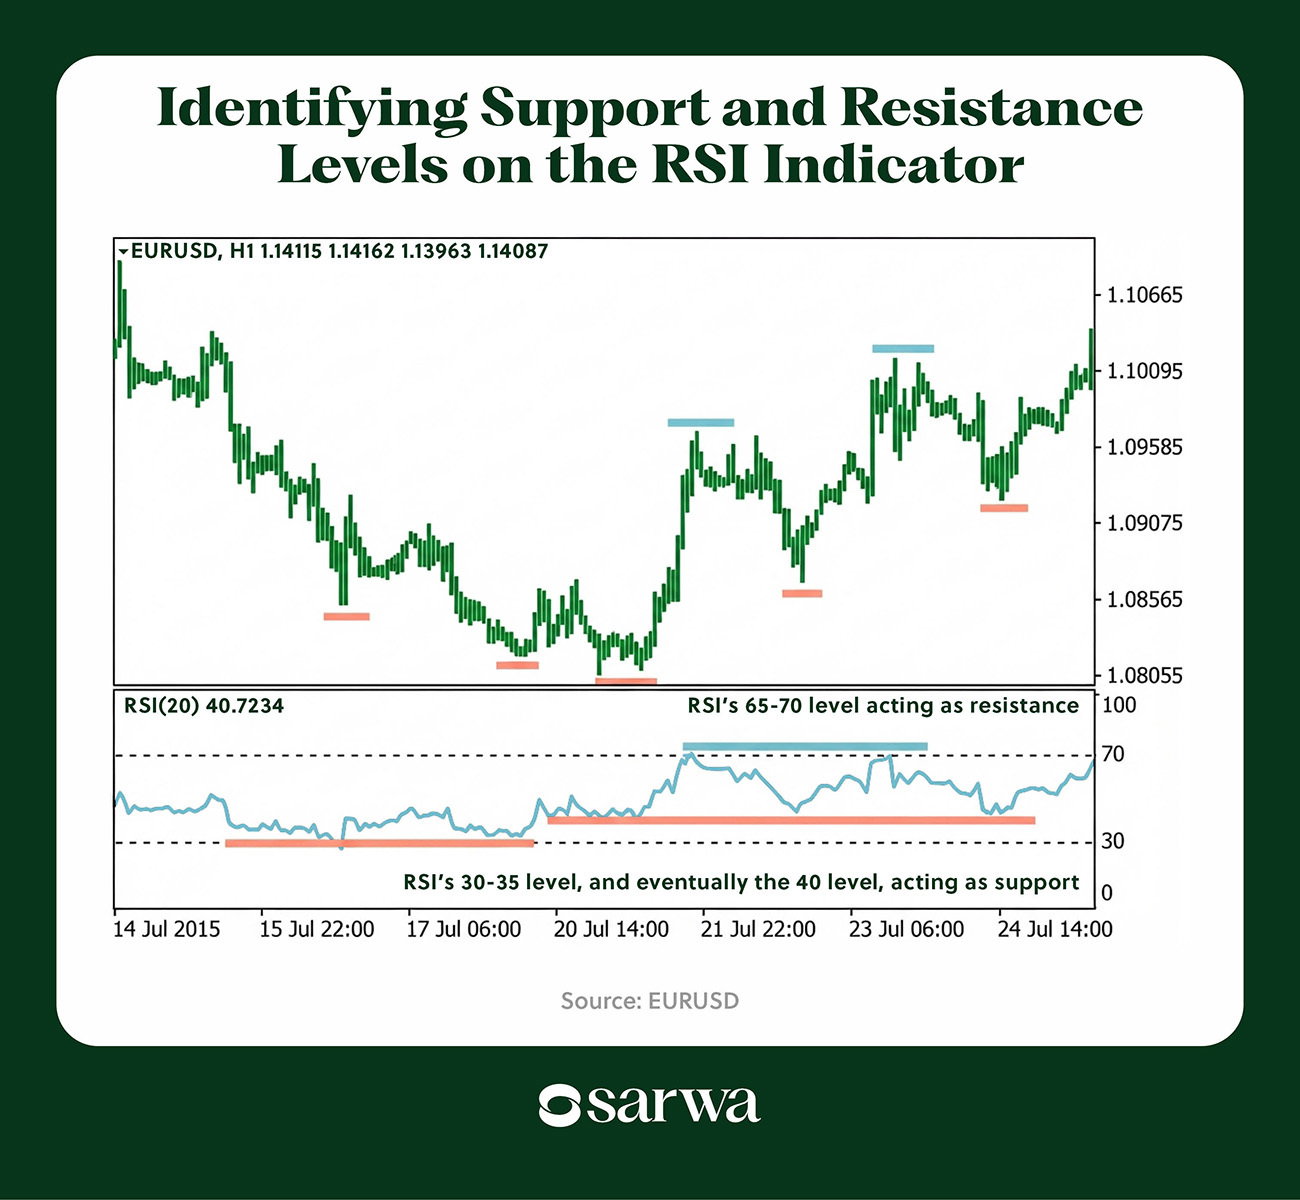
Instead of using particular figures, some traders prefer to look at the historical trend to see which levels have traditionally acted as support and resistance levels for a given asset.
On-balance volume (OBV)
Experienced traders often prefer to confirm price action with trading volume to confirm the strength of any developing thesis.
This also works with support and resistance. Some of the popular volume indicators include On-balance Volume (OBV), Volume Profile, and the Accumulation/Distribution Line.
We’ll focus on the OBV in what follows.
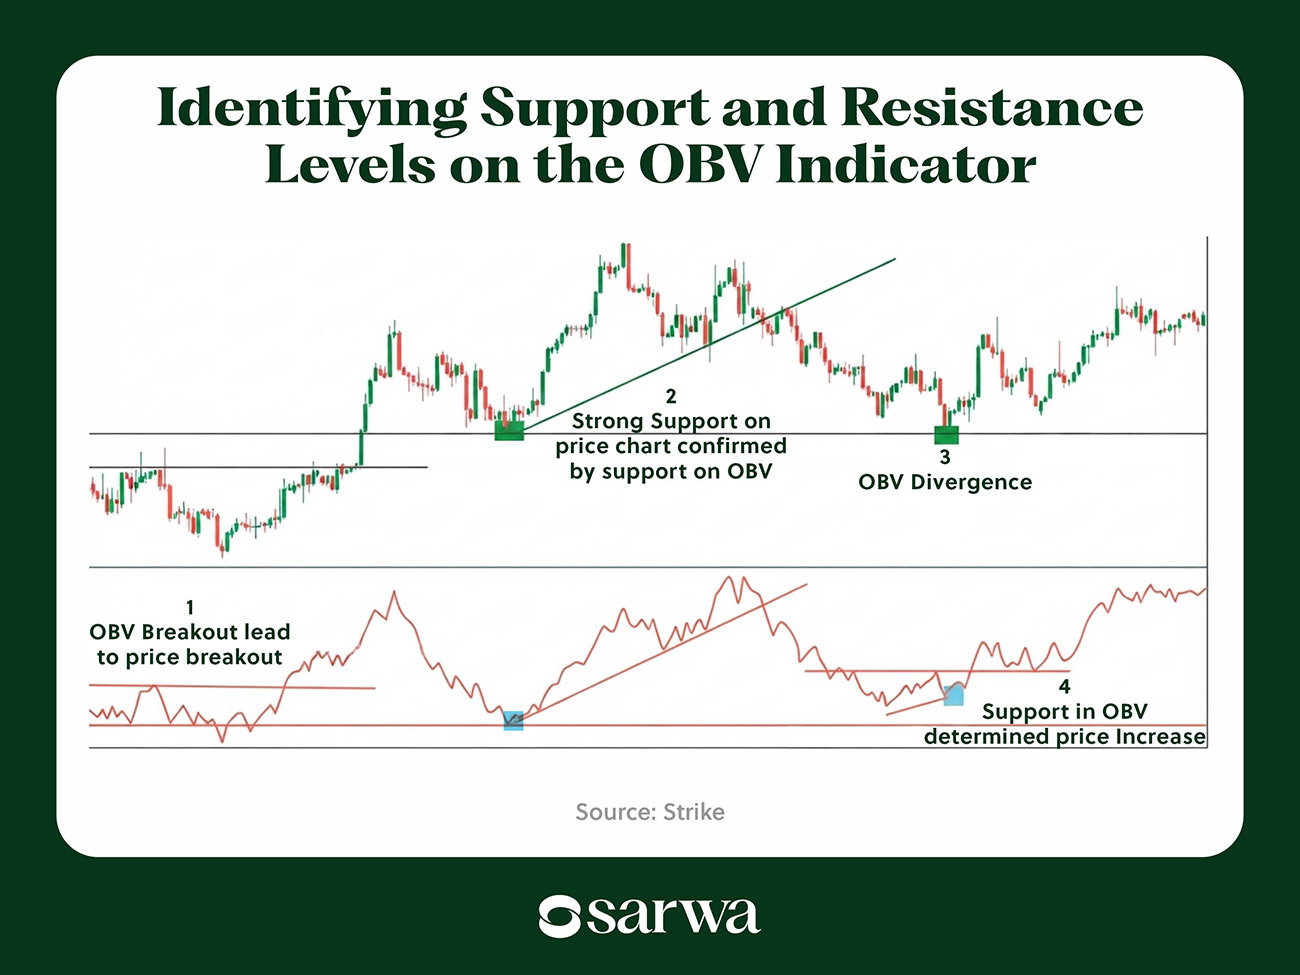
Finding a support zone on the OBV indicator at the same point as the price chart can give you greater confidence that buyers are really respecting that zone.
Below is an example of how the OBV indicator supports price charts:
Pivot points
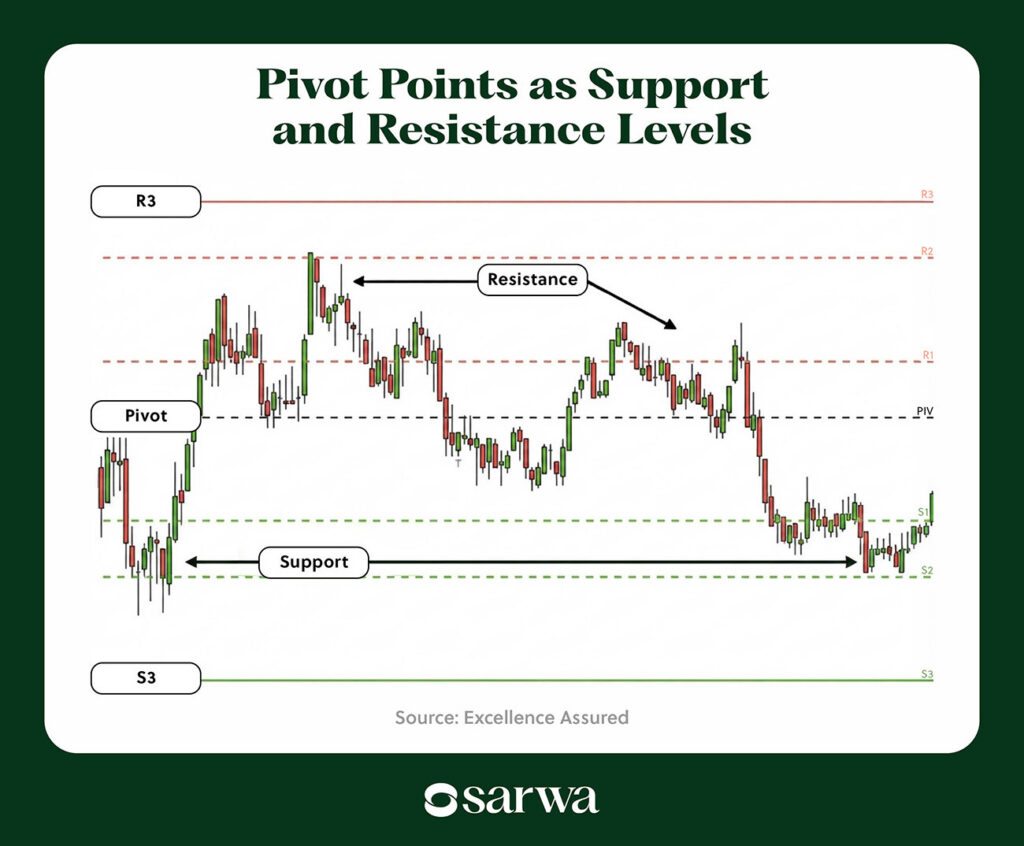
Pivot points are support and resistance levels drawn on price charts based on the price action of the previous trading session.
The main pivot point is an average of the previous session’s high, low, and close. This becomes the basis for the other pivot highs and pivot lows, which serve as support and resistance levels.
You can have greater confidence when the support and resistance levels from the pivot points align with the ones you draw on the price chart yourself. Below is an example of such an alignment:
4. Support and resistance trading: The most popular strategies
Support and resistance levels have always played important roles for technical traders, across all markets.
It’s especially favored by price action traders, who prefer to create trading strategies around price chart data instead of depending on (lagging) indicators.
In what follows, we will consider some of the support and resistance strategies that traders commonly use.
Range trading
Range trading is a strategy that involves buying at the support zone and selling at the resistance zone, or short selling at the resistance zone and closing the trade at the support zone.
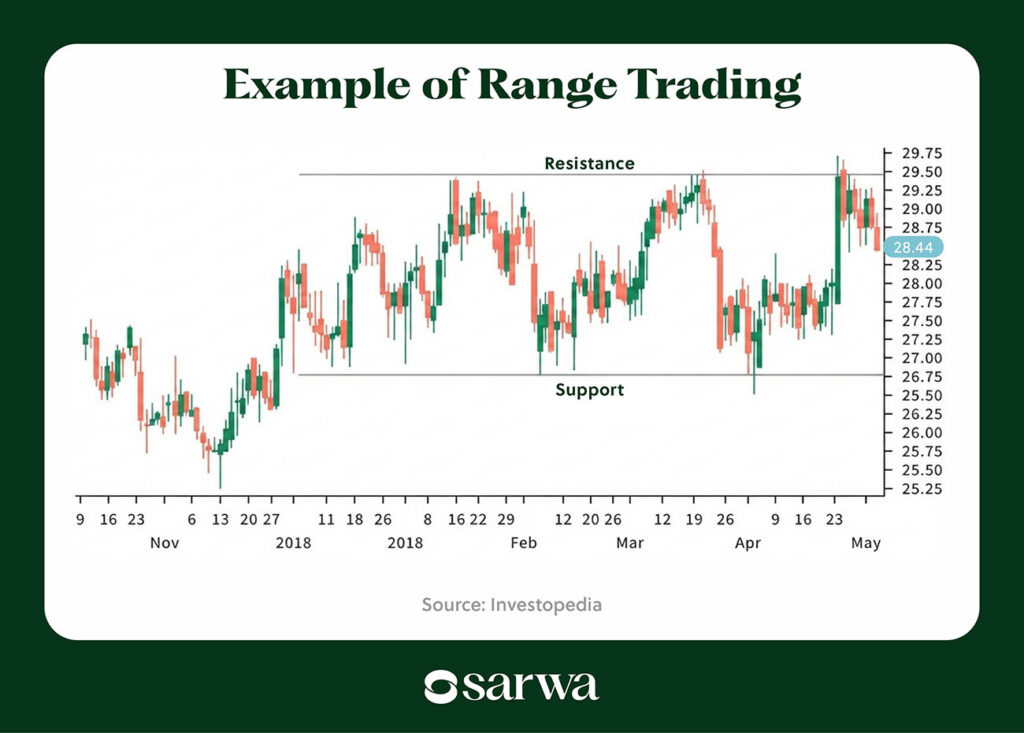
Range trading is a popular way to trade assets that are in a consolidation phase, moving predictably from support to resistance.
Experienced range traders often use the RSI as a confirmation tool before buying into support or selling at resistance. For example, some wait until we are in an oversold condition before buying and an overbought condition before selling.
Alternatively, they can wait for reversal candlestick patterns, like a hammer or a gravestone doji, to develop at support or resistance zones to confirm the change in market sentiment.
Since Bollinger Bands also move within a range, many range traders also use them as confirmation signals. In this case, the lower band can act as a support level while the upper band acts as a resistance level.
Breakout trading
The market does not respect support and resistance levels indefinitely. At some point, there will be a breakout to the upside or the downside as buyers or sellers struggle to keep up.
Some traders focus on identifying possible breakout points and profiting from the ride to the upside or downside.
“A sustained break above a significant resistance level, especially on increased volume, often signals the start of a new uptrend,” according to Indrajit Mukherjee, founder of Stock Maniacs, a stock market research and analytics platform. “Conversely, a decisive breakdown below support can precede further declines.”

Below is an example of a breakout on a price chart:
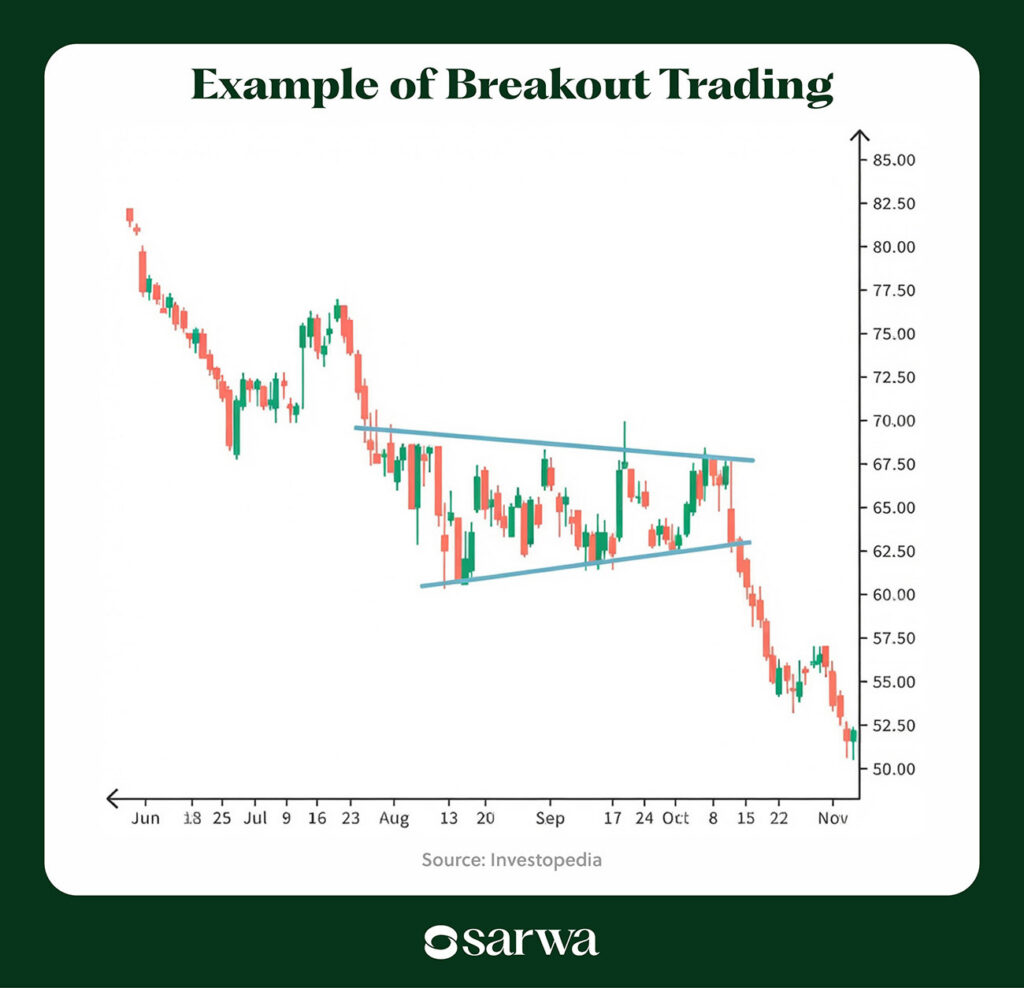
The main challenge with breakout trading is identifying when a breakout is likely to occur. Many traders rely on bullish or bearish continuation candlestick patterns, like the bearish and bullish mat, appearing within support and resistance zones.
Some also look out for volume spikes (using the OBV, for example), rising momentum (with indicators like RSI, MACD, and the Stochastic Oscillator), and a divergence between the price chart and indicators like the RSI and the MACD.
Pullback trading
After a breakout, price can return to the previous support (resistance) zone and act from it as a new resistance (support) zone. When this occurs, technical traders say the support has become resistance, and vice versa.
Pullback trading involves buying at the resistance that became support and selling at the support that became resistance.
Below is an example of pullback trading in practice:
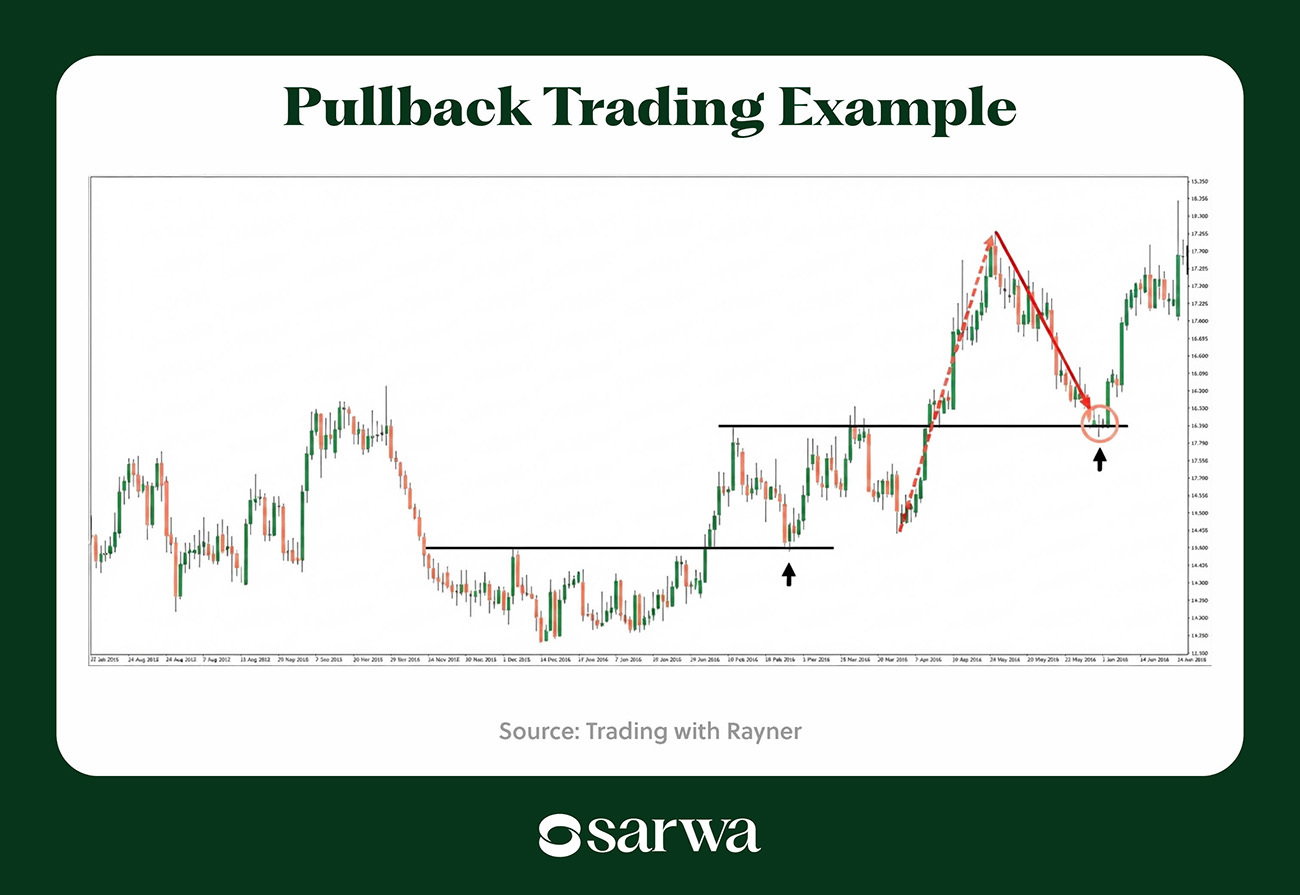
When the resistance got broken, price pulled back to retest the level, and it became the support for a rapid rise to the uptrend.
As with range trading, experienced traders will wait for bearish or bullish reversal candlestick patterns or a momentum indicator like the RSI before buying at the new support or selling at the new resistance.
Trendline bounce trading
The trendline bounce trading strategy is the trending market version of range trading. Instead of a vertical trading range, price moves from the trendline support to the trendline resistance, and traders seek to profit from those constant movements.
Below is an example of how this works:
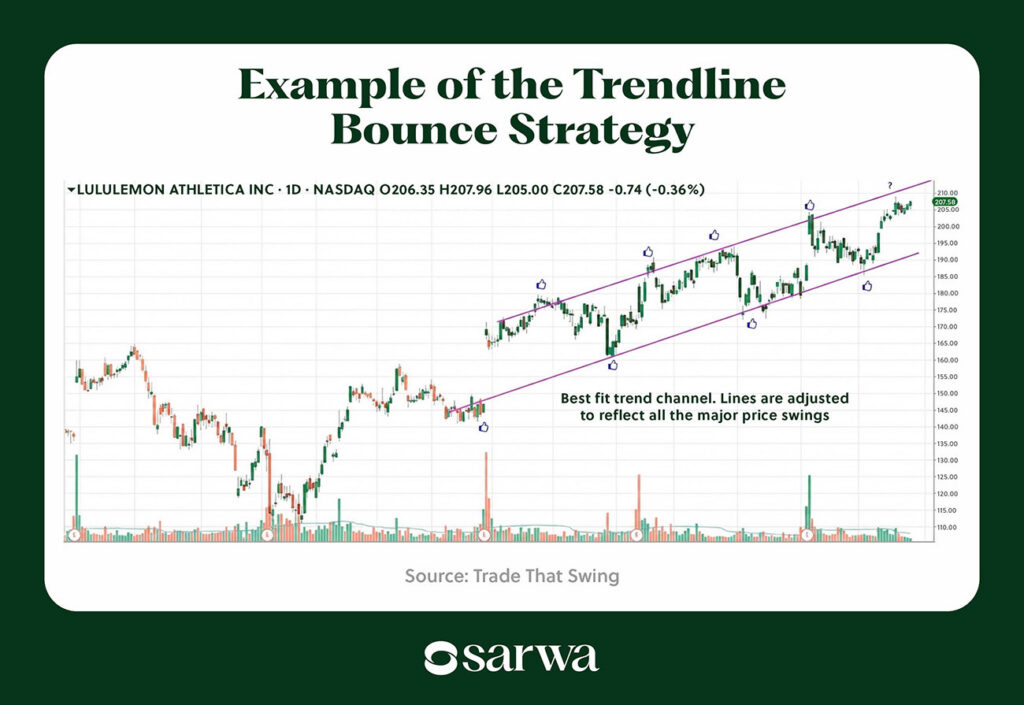
Like range trading, experienced traders will wait for confirmation from candlestick patterns and momentum indicators at the trendline support or resistance before taking a trade.
Tips for support and resistance trading
If you are new to support and resistance trading, below are some pro tips that can help you better navigate the market:
- Use multiple timeframes: As we have said, it is important to use longer timeframes for market structure and lower ones for precise entry and exit points.
- Always wait for a confirmation: Irrespective of how good you are at drawing support and resistance levels or using support and resistance indicators, you still need to wait for a confirmation from candlestick chart patterns, indicators, and even chart patterns before taking a trade.
“Support and resistance only indicate where price may react,” according to Ian. “It doesn’t indicate the direction of the reaction, and that’s why I don’t use it unless I have confirmation from other signals.”
- Use stop losses that align with your risk management strategy: Your stop loss should be at a safe distance from the support and resistance zone. How big the distance should be depends on your position size and risk-reward ratio. Many expert traders often use the Average True Range (ATR) indicator to ensure their stop losses increase or decrease with market volatility. For example, in volatile markets, the ATR widens as traders try to avoid being shaken out of the market.
- Use indicators wisely: Indicators are known to lag behind price action data. They are, therefore, better used as confirmation signals rather than main trading signals.
Also, with indicators, the fewer, the better. Instead of using a large number of indicators, select one or two indicators for a single purpose. For example, you can use the RSI and MACD as your momentum signals and moving averages as your trend identifiers.
- Focus on the most important zones: There will often be multiple possible support and resistance levels on a chart. The goal is to select the most relevant ones. Look out for those with multiple touches and/or prioritize those that align with the support and resistance indicators.
- Use support and resistance as screening criteria: Some stock screeners include various technical criteria that can help you identify assets with the most trading potential.
If you are a stock trader, you can find support-level stocks by screening only for stocks that are trading near the support zone. This helps you narrow your focus as you look for trading opportunities.
Once you are ready to enter the market, you need a trading platform that can allow you to nail down precise entry and exit points.
With Sarwa Trade, you can create both market and limit orders on stocks, ETFs, and cryptocurrencies, giving you the flexibility to enter and exit at the exact price you want.
Also, we provide free transfers between your local bank account and your Sarwa brokerage account, and we protect your data and money with bank-level 256-bit encryption.
Furthermore, we support your trading journey with free resources on personal finance management, fundamental and technical analysis, and understanding various financial markets.
Are you ready to execute your support and resistance trading strategies? Sign up now for Sarwa Trade for seamless, convenient, and cost-effective trading of stocks, ETFs, and cryptocurrencies in the UAE.
Takeaways
- Support and resistance levels help traders identify turning points that the markets have expected and can still respect in the future.
- By using support and resistance indicators, traders can nail down support and resistance levels with greater accuracy.
- Different market conditions require different support and resistance trading strategies, from range trading and breakouts to pullbacks and trendline bounces.
- When using support and resistance levels for trading, use indicators and candlestick chart patterns for confirmation before entering or exiting a trade.
Frequently Answered Questions
1. Can AI identify support and resistance levels better than manual analysis?
AI can identify support and resistance levels much faster by automatically scanning charts and recognizing recurring price patterns. However, experienced traders still use manual analysis alongside AI to validate key levels and account for market context.
2. What indicators work best alongside support and resistance for UAE traders?
Commonly used indicators include moving averages, RSI, Fibonacci retracement levels, OBV, and pivot points, as they help confirm whether a support or resistance level is likely to hold. These indicators can be applied to global stocks, ETFs, cryptocurrencies, and other assets traded by UAE traders.
3. Is support and resistance analysis reliable enough to use alone for trading decisions?
Support and resistance are valuable tools, but they are generally more effective when combined with confirmation signals such as candlestick patterns, momentum indicators, or volume analysis. Relying on multiple forms of analysis can help reduce false signals and improve overall trading decisions.