
What if you could trade market swings without spending every waking hour watching charts? Or look for opportunities beyond the daily noise without committing your money to a stock for years?
That’s the appeal of swing trading: a middle ground between the intensity of day trading and the patience required for position trading or long-term investing. Instead of opening and closing positions within the same day, swing traders typically hold trades for several days to a few weeks, aiming to capture meaningful price moves while giving their strategies room to work.
But swing trading isn’t simply day trading with fewer screen hours. It involves a different approach to timing, chart analysis, and risk management. Traders often use moving averages, chart patterns, and momentum indicators to identify potential entry and exit points, while accepting that overnight market movements can affect their positions.
In this guide, we’ll explain what swing trading is, how it compares with day trading and buy-and-hold investing, how to identify swing trade setups using moving averages and chart patterns, and what UAE traders need to know about executing swing trades.
We’ll cover:
- What is swing trading: How it differs from other approaches
- How to pick stocks for swing trading: The importance of liquidity and volatility
- Overview of popular swing trading strategies
- How to swing trade: Practical tips you can’t ignore
Do you want to understand happenings in the global financial market and the trading opportunities they present? Subscribe now to Sarwa’s Fully Invested newsletter for expert insights.
1. What is swing trading: How it differs from other approaches
Swing trading is the middle ground between day trading and position trading or long-term investing.
It involves holding stocks or other assets for a few days to several weeks. The swing trader’s goal is to capture short-to-medium-term price movements over multiple sessions.
As a trading approach, swing trading profits from momentum shifts, buying when prices are poised to rise and selling when they begin to fall. In other words, it prioritizes market trends and momentum variations.
A better way to understand swing trading is to see how it differs from day trading and position trading.
Swing trading vs day trading
Below are the practical differences between swing trading and day trading:
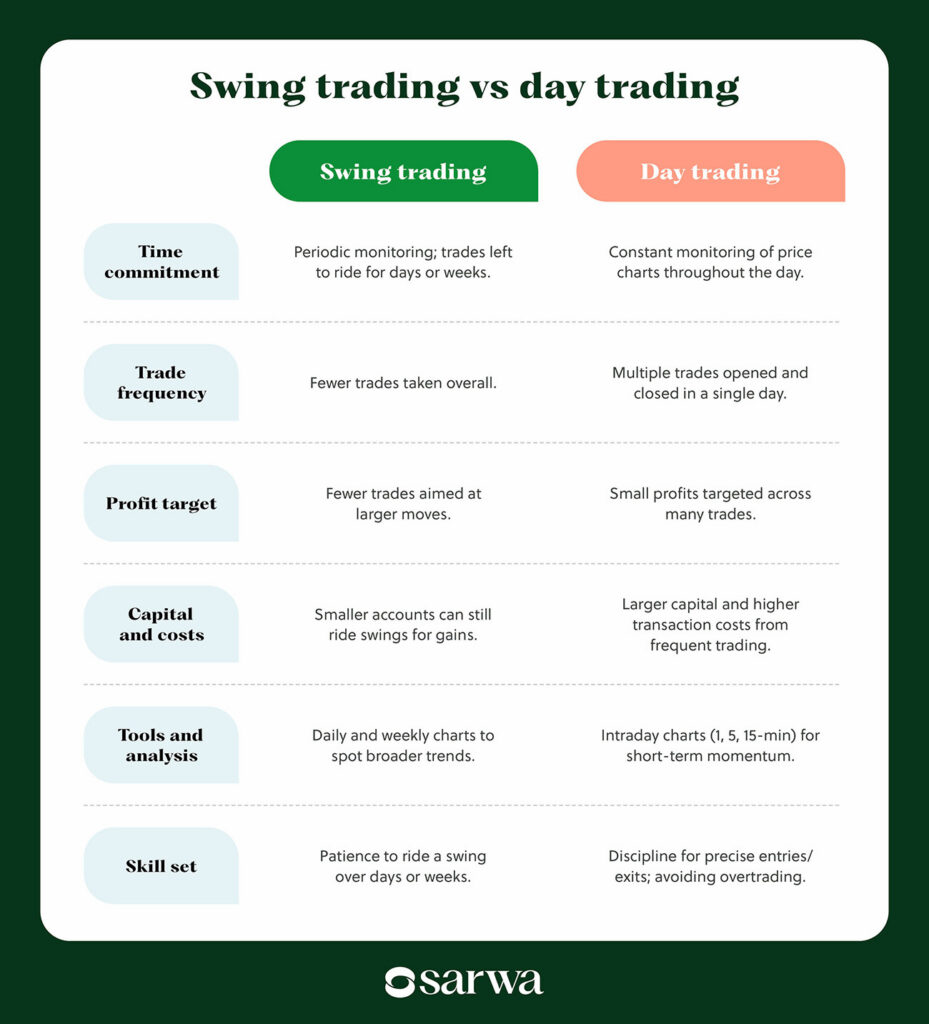
- Time commitment: Day trading requires constant monitoring of price charts throughout the day. Swing trading, on the other hand, requires only periodic monitoring of price charts since trades can be left to ride for days or weeks.
- Trade frequency: Day traders can open and close multiple trades in a single day, while swing traders tend to take fewer trades.
- Profit target: Day traders target small profits on many trades, while swing traders focus on fewer trades that can produce large moves.
- Capital and costs: Day trading often requires larger capital to make the small gains add up to something worthwhile. With swing trading, smaller accounts can still ride market swings for significant profit.
Also, day traders incur higher transaction costs (due to higher trading frequency).
- Tools and analysis: Day traders rely heavily on reading intraday charts (1-min, 5-min, 15-min) and top technical indicators for day trading to identify short-term momentum. On the other hand, swing traders focus on 4-hour, daily, or weekly charts to identify broader trends.
- Skill set: Both approaches require a good grasp of technical analysis. However, day trading requires the discipline to set and stick to precise entry and exit points and avoid overtrading. Swing trading, on the other hand, requires the patience to ride a market swing even if it takes days or weeks.
Swing trading vs position trading
Below are the main differences between swing and position trading:
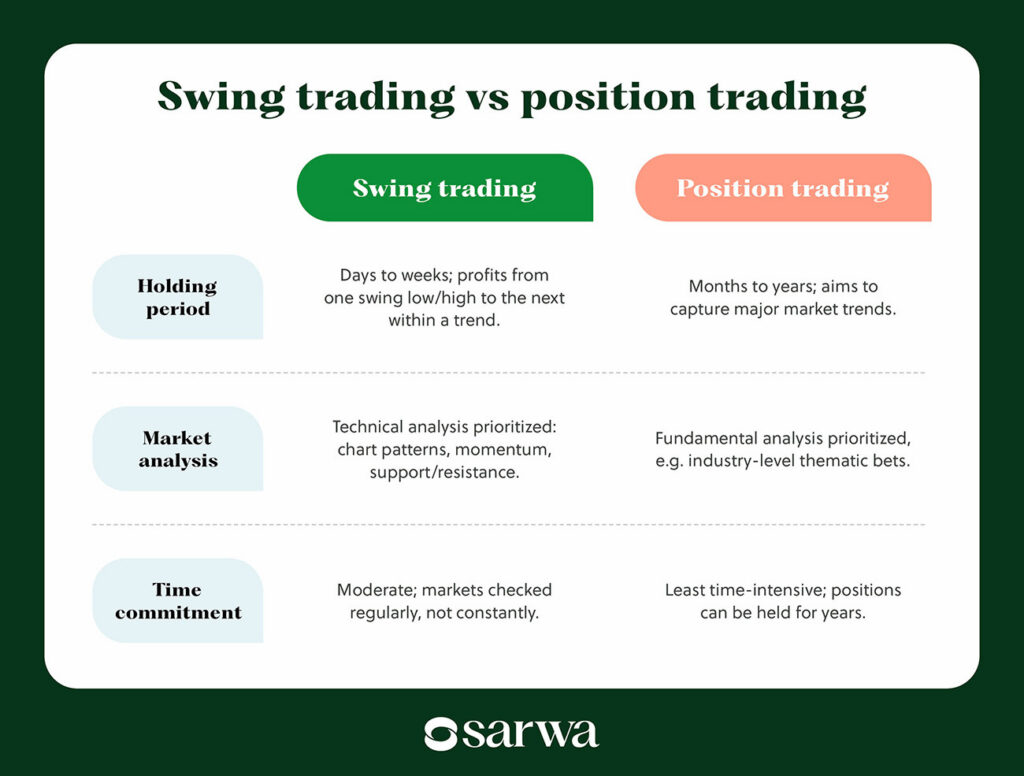
- Holding period: Swing trades last for a few days to a few weeks. The aim is to profit from price swings (one swing low to one swing high or one swing high to one swing low) within a broader market trend.
On the other hand, position trades can be held for months or even years since the aim is to capture major market trends rather than short-term fluctuations.
- Market analysis: Though many swing traders conduct both fundamental and technical analysis of stocks, the latter is the priority. Swing trading relies heavily on chart patterns, momentum indicators, and support/resistance levels.
Though some position traders may conduct technical analysis, the focus is often on fundamental analysis. For example, a position trader may look at the impacts of artificial intelligence (AI) on an industry and go long on the belief that it will improve the bottom line of industry players.
- Time commitment: Swing trading still requires moderate time commitment since traders monitor markets regularly, even if not constantly. Position trading is even less time-intensive since many traders can hold a single position for years.
2. How to pick stocks for swing trading: The importance of liquidity and volatility
Picking stocks (or other assets) for swing trading is all about finding shares with enough volatility to create short-term opportunities and liquidity to make the trade manageable.
Below are some of the criteria swing traders look for when screening stocks for swing trading:
Strong liquidity
Stocks with strong liquidity are preferable for swing trading because they tend to have more consistent trading activity, tighter bid-ask spreads, and easier entry and exit.
The last point is especially important since there is nothing that hurts a swing trader more than staying in a bad trade for more days and weeks due to the absence of liquidity.
Swing traders will filter stocks based on average daily trading volume and the bid-ask spread to ensure they have enough liquidity. This is why they prefer large-cap stocks and ETFs.
Sufficient volatility
Swing trading, unlike day trading, thrives on large moves over days or weeks rather than small moves that occur intraday.
Therefore, swing traders prefer stocks with prices that swing enough to generate meaningful returns. Practically, they look for a middle ground between stocks that are too volatile (which become unpredictable) and those that barely move.
Swing traders will filter stocks based on measures like the average true range (ATR), percentage price movement over a given period, and historical volatility.
Clear market trend
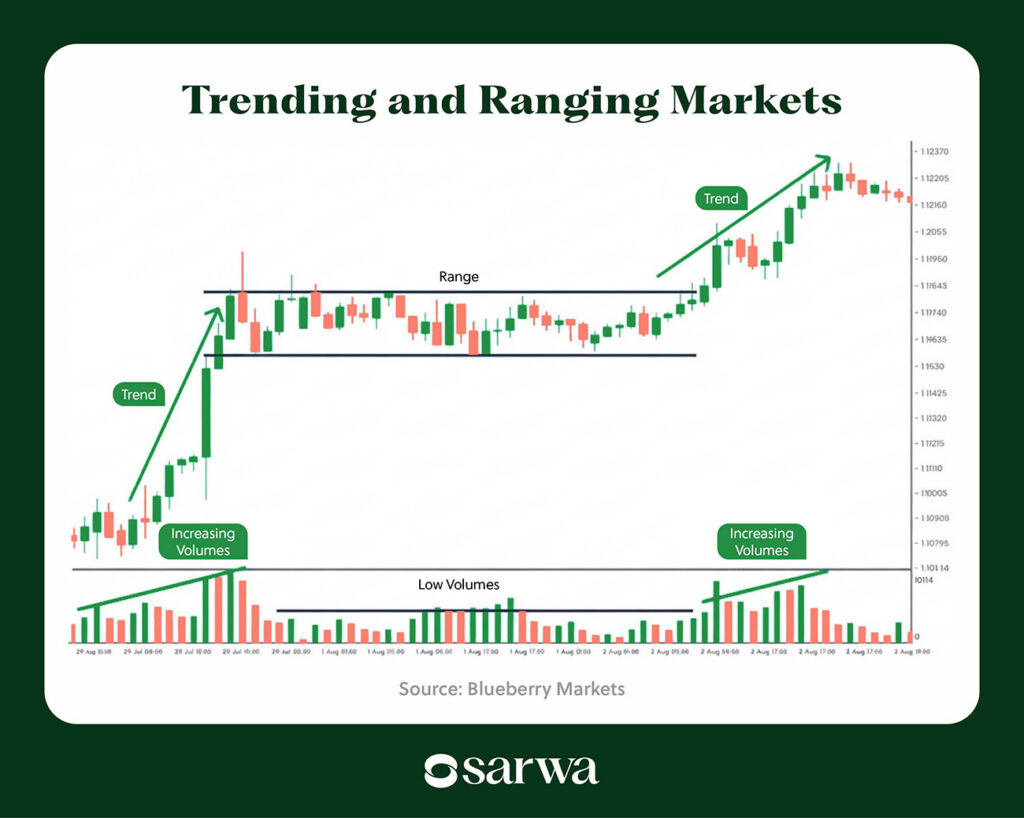
As said above, swing trading relies on profiting from short-term swings within broader market trends. This is why some swing traders only execute their strategies in trending markets, ignoring ranging or consolidation markets.
Source: Blueberry Markets
In trending markets, prices make sustained moves in one direction, allowing traders to ride the swing for several days or weeks. They also make trend-following strategies easier, especially when there is strong momentum to support the current trend.
Nevertheless, it is worth stating that some swing traders still execute range trading strategies, buying near support and selling near resistance, for example. But such trades have lower potential gains and higher risk.
3. Overview of popular swing trading strategies
While there are common grounds between all swing traders, strategies still differ.
In what follows, we consider the most popular strategies swing traders use to ride market swings in upward-trending and downward-trending markets.
1. Trend following strategy
Trend following strategy is all about trading in the direction of the prevailing trend. Swing traders look for long opportunities in an uptrend and short opportunities in a downtrend.
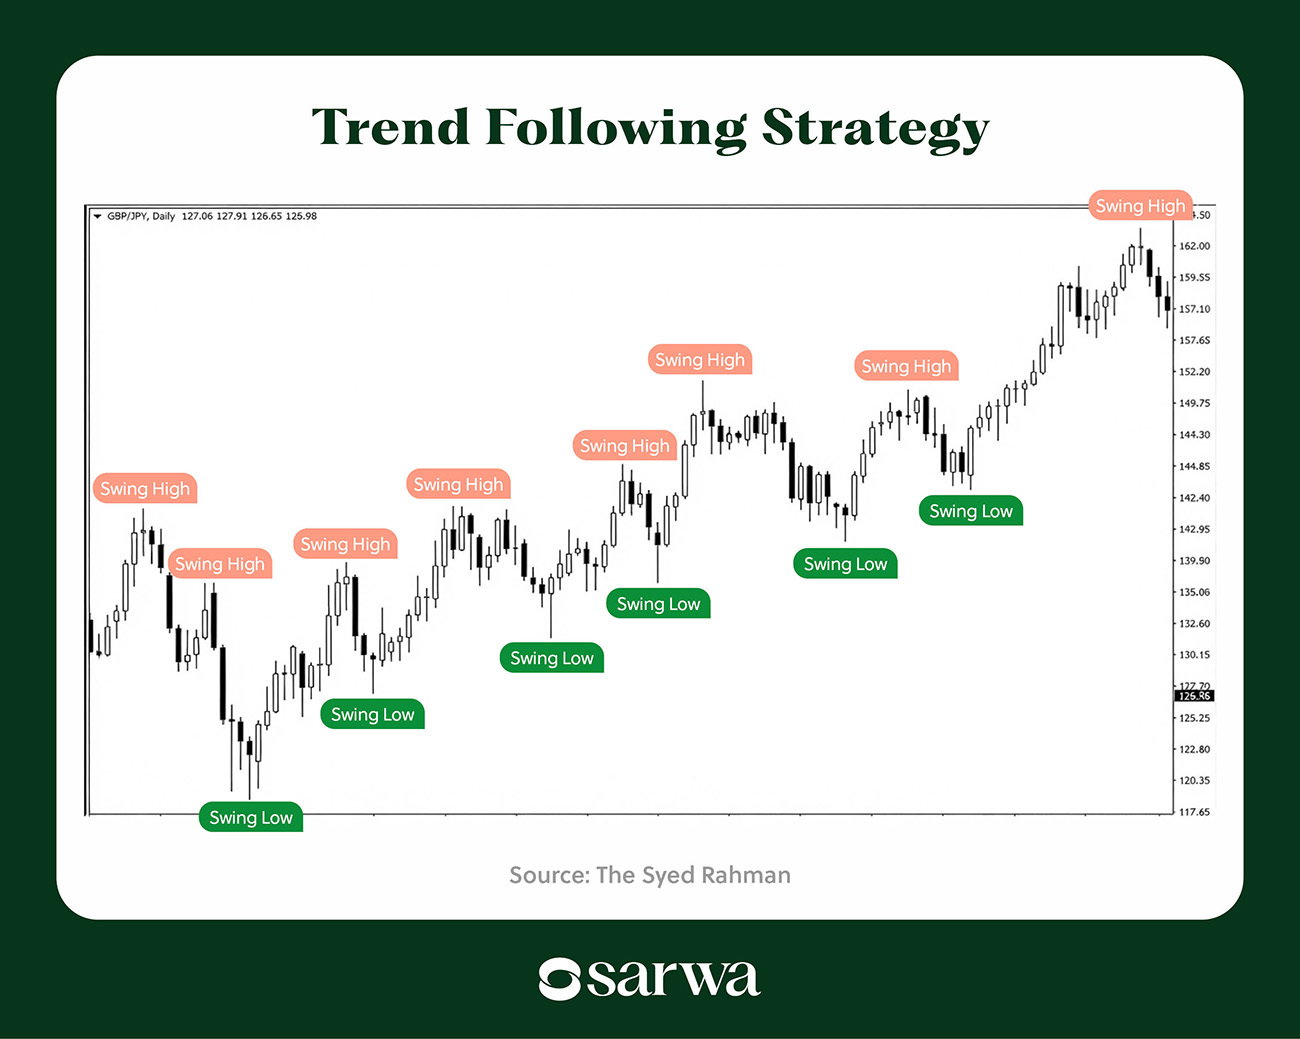
The idea is to look for a pullback to a swing low in an uptrend and ride the wave to the next swing high, or a swing high in a downtrend and ride the wave to the next swing low.
Consider the following chart as an example:
Source: The Syed Rahman
In this example, the market is clearly in an uptrend. A trend-following swing trader will look for a swing low and then ride the wave from there to the next swing high.
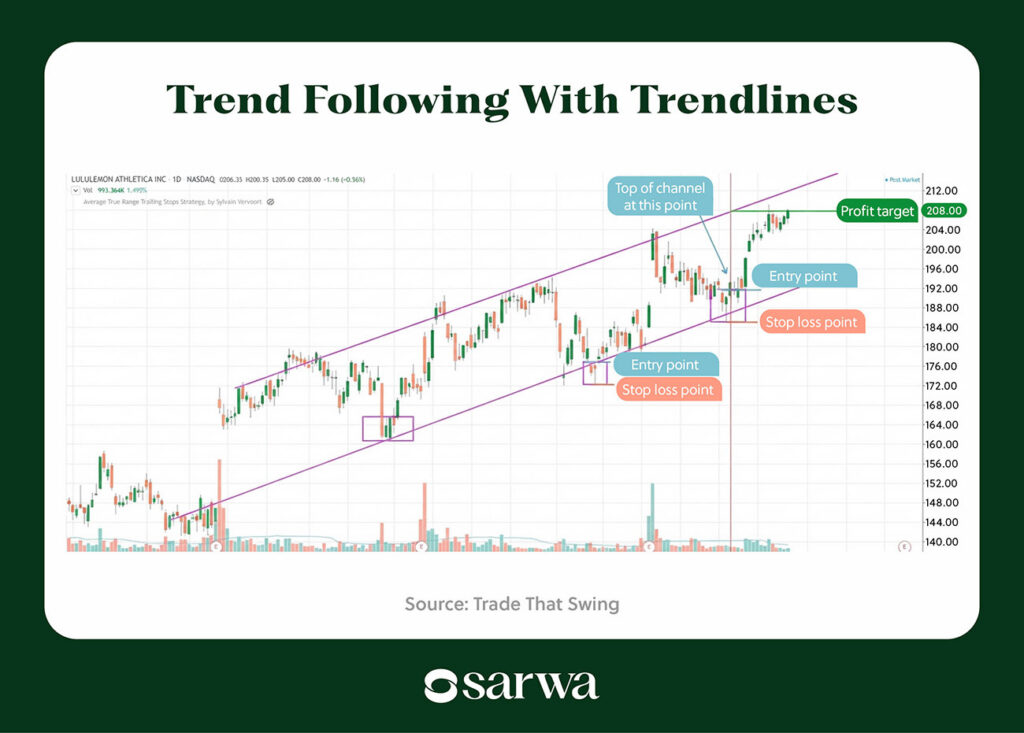
Swing lows and highs are often marked out by moving averages, trendlines, or Fibonacci retracements. Below is an example done with trendlines:
Source: Trade That Swing
The lower trendline can help identify the next swing low, from which point the swing trader rides the wave to the next swing high (based on the upper trendline).
2. Moving average pullback strategy
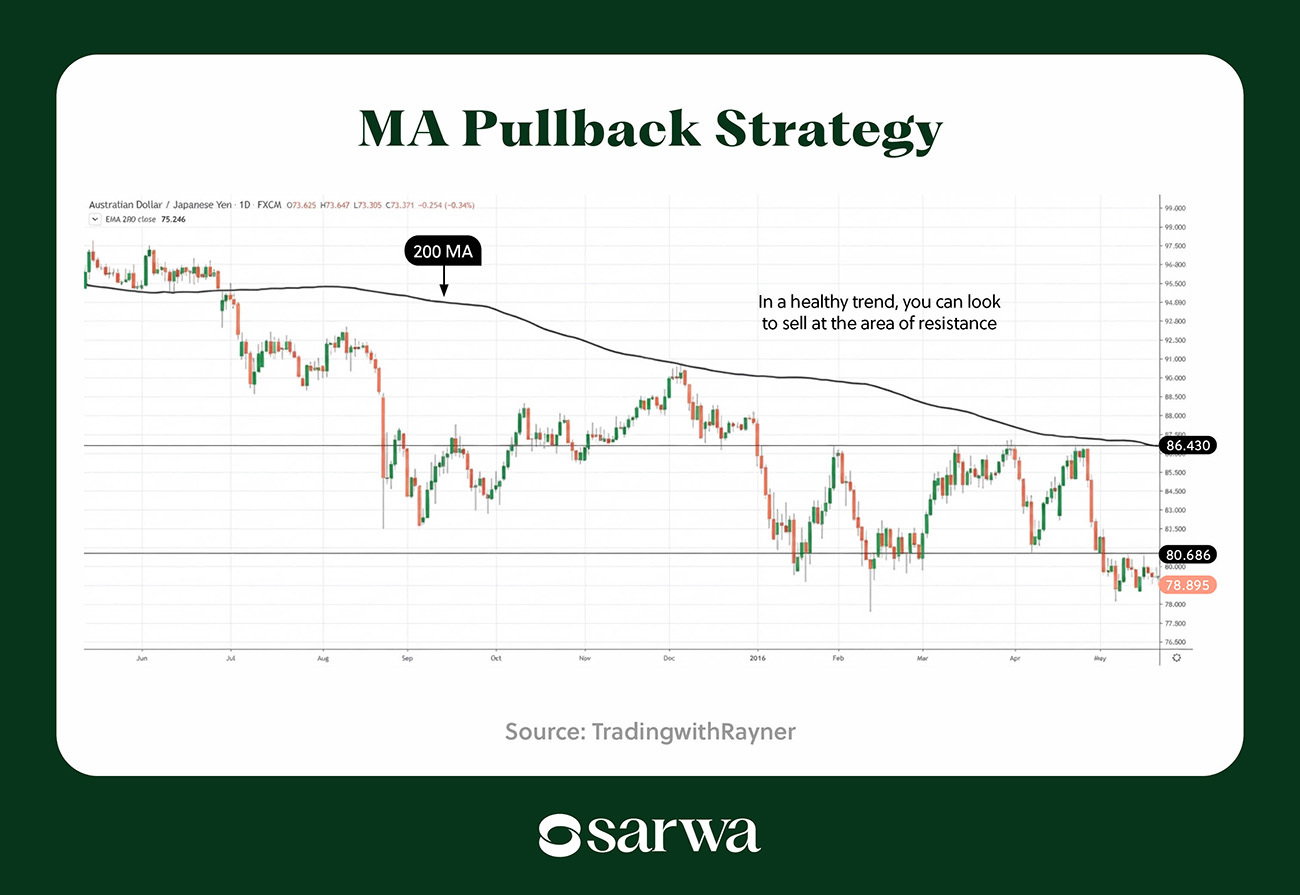
The MA pullback strategy is basically a trend-following strategy that relies on moving averages for identifying pullbacks within the broader trend.
In this strategy, a moving average (simple or exponential) acts as support or resistance (instead of the trendline).
Swing traders look for opportunities to go long or short at the MA-defined support or resistance.
“My trading strategy heavily revolves around trading in the direction of daily trends, whereby I place my orders at pullbacks to key exponential moving averages,” according to Hamid Ali, a quantitative market analyst and the CEO of Word Layouts, a platform providing Word, Excel, and PowerPoint templates. “This contrasts with the majority of day traders who buy into breakouts.”
Below is an example:
Source: TradingwithRayner
Here, the 200 MA acts as the resistance in a defined downtrend. Swing traders can look for swing highs at resistance and short the asset as it moves down to a new swing low.
3. Counter-trend strategy
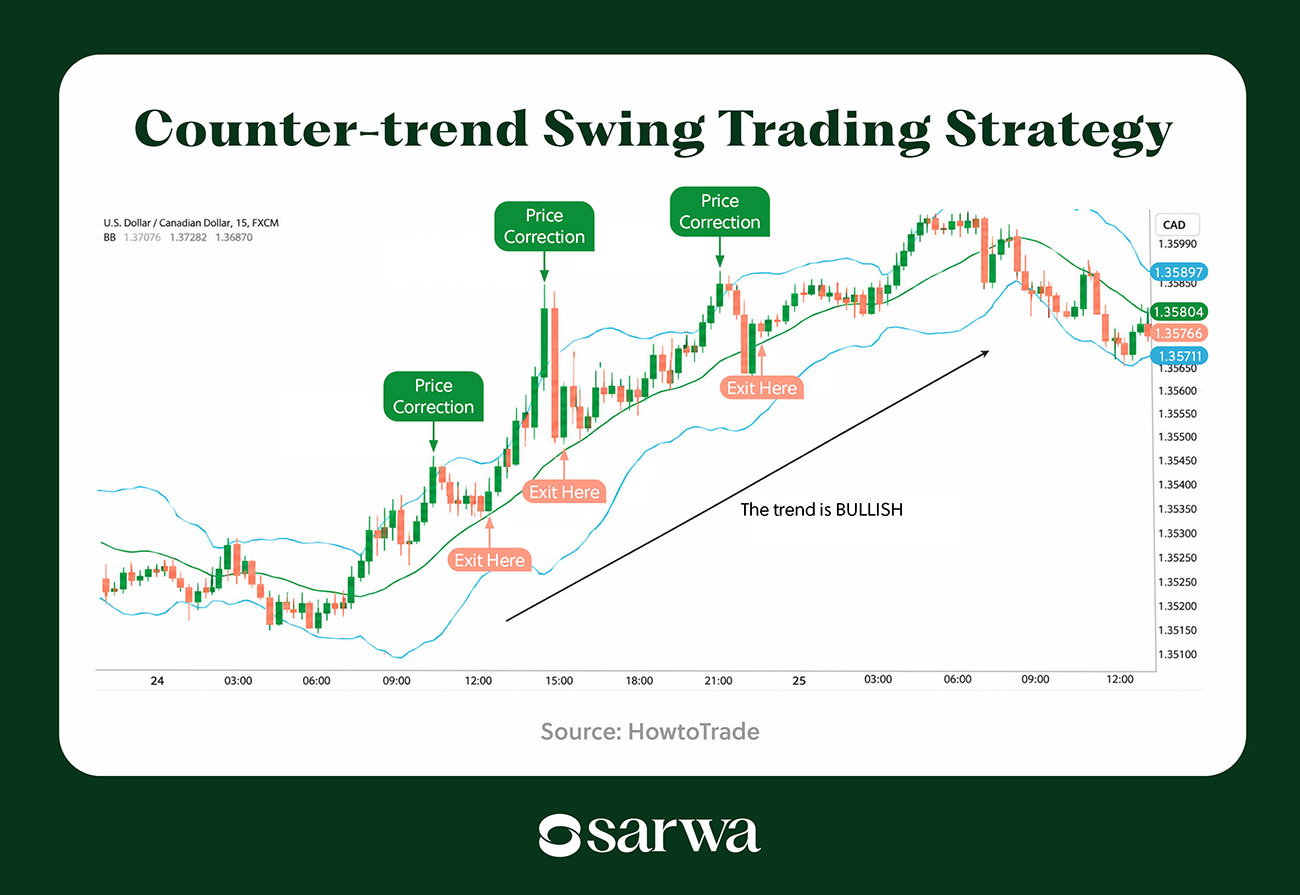
Instead of following the trend, a counter-trend strategy trades in the opposite direction.
For example, it sells in a bullish market and buys in a bearish market.
Counter-trend strategies are generally frowned upon, especially for new traders.
However, some experienced traders use them, supported by reversal candlestick chart patterns and indicators that help mark out possible reversals (the Relative Strength Index (RSI) indicator, for example).
Consider this example:
Source: HowtoTrade
Here, we have an uptrending market. Instead of buying at the swing low and selling at the swing high, the swing trader shorts at the swing high and then closes the trade at the next swing low.
As with trend-following strategies, swing lows and highs can be marked out by trendlines, moving averages, and Fibonacci retracement.
4. Breakout trading strategy
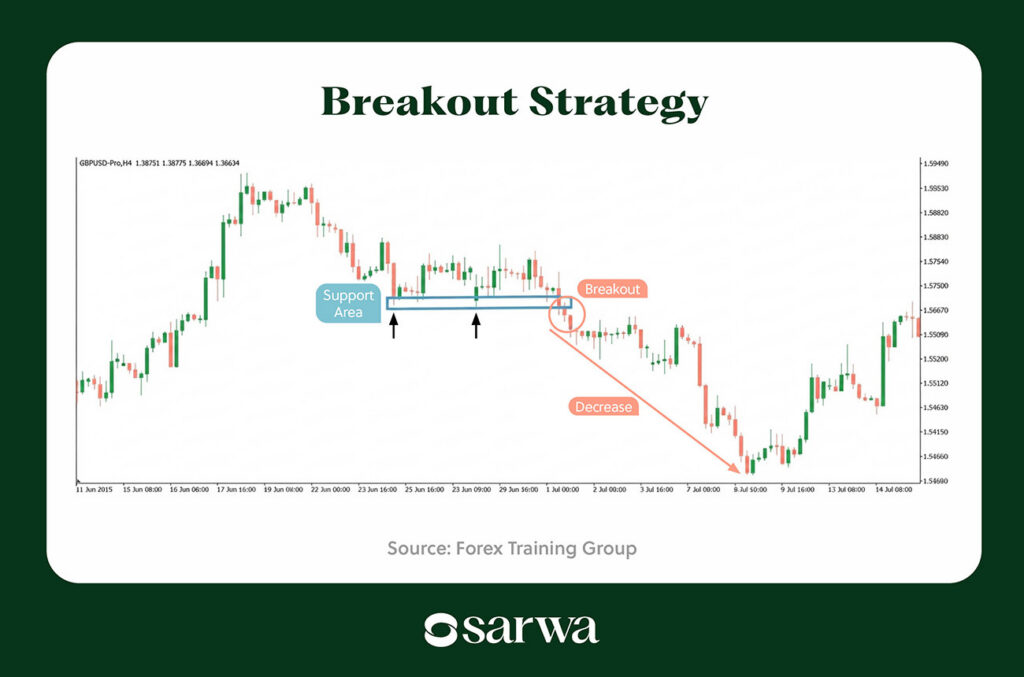
A breakout occurs when a stock moves beyond a price level that has previously limited its movement.
Swing traders use breakout strategies to capture potential momentum after a stock escapes a trading range (support or resistance zones).
In many cases, the new swing after the breakout continues until the stock reaches a previous or new support or resistance level.
Below is an example:
Source: Forex Training Group
In this example, the asset broke out of a horizontal support zone to the downside with strong momentum. A conservative swing trader will ride this new wave until price reaches a previous support level in sight, while a more aggressive trader will ride it (using trailing stop-loss orders) until the downtrend shows a sign of exhaustion (indicated by candlestick chart patterns).
Experienced traders will often confirm such breakouts with candlestick chart patterns or momentum indicators like the Moving Average Convergence Divergence (MACD) and the Stochastic Oscillator.
5. Moving average crossover strategy
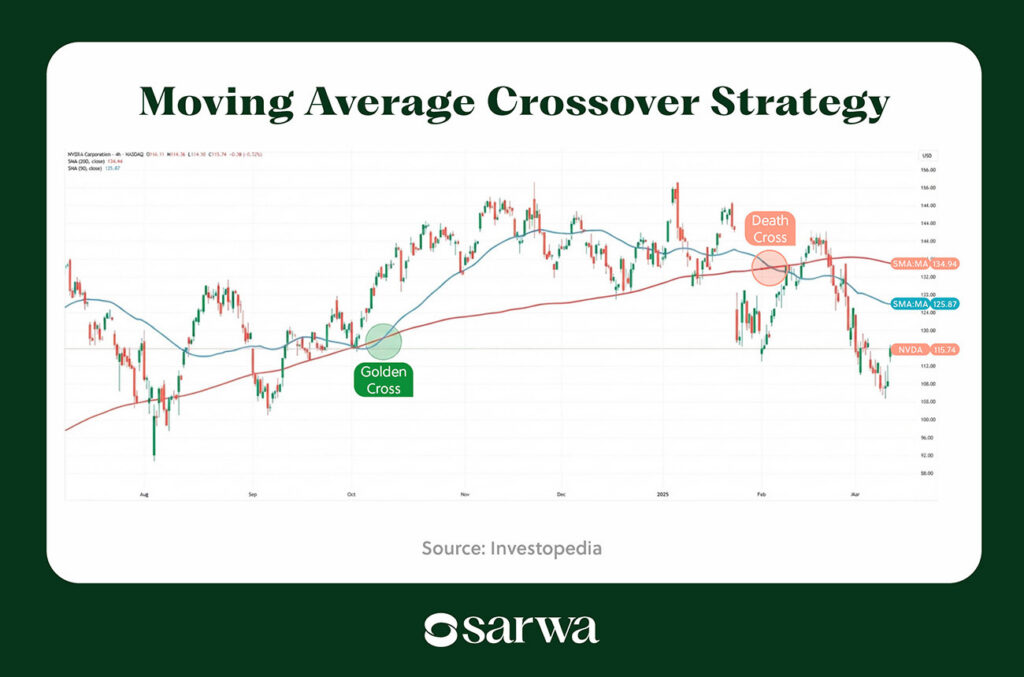
The MA crossover strategy relies on the crossover between a short-term (50 MA, for example) and a long-term MA (200 MA, for example).
A buy signal occurs when the short-term MA crosses above the long-term MA from below (also called the “golden cross”), while a sell signal occurs when it crosses below the long-term MA from above (also known as the “death cross”).
Source: Investopedia
The 50 MA is shaded blue while the 200 MA is shaded red.
The first cross in this example is a golden cross as the 50 MA crosses above the 200 MA from below. After this, the price went on an upward run. A swing trader would capture that large swing from the golden cross to the swing high.
The death cross occurred months later. Here, the 50 MA crosses below the 200 MA. However, the downward run did not start until some days later. When it did start, it ended up being a significant ride to the downside.
6. RSI swing trading strategy
Swing traders mainly use RSI in two ways.
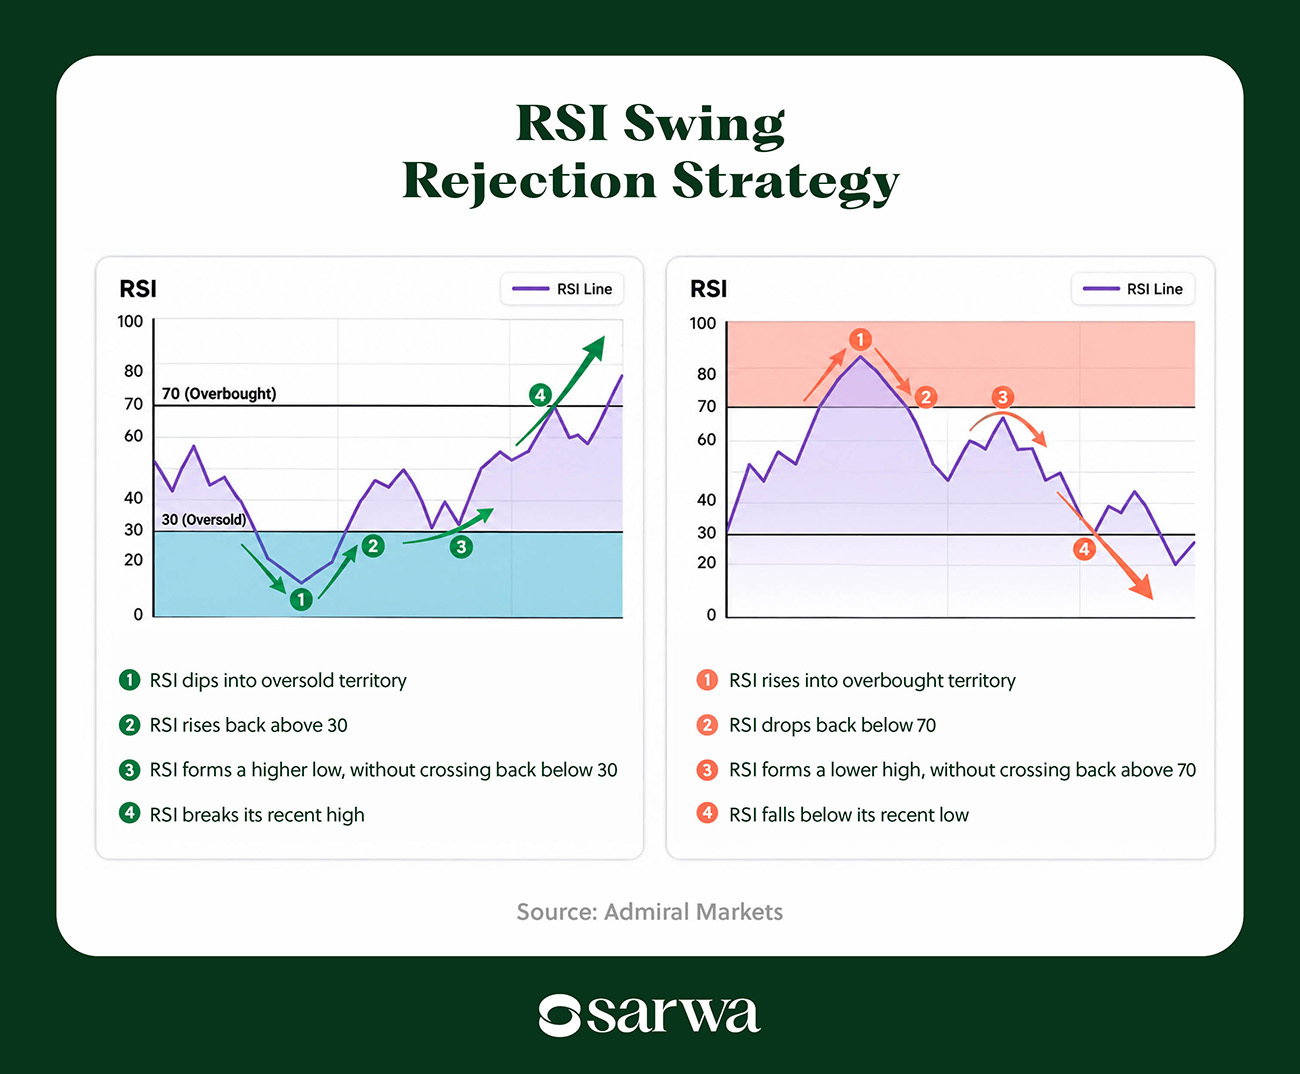
The first is the RSI swing rejection strategy.
This strategy can be bullish or bearish.
In the bullish example, the RSI drops below 30 (oversold level), rises above it, dips again but stays above 30, then breaks its previous swing high for momentum to the upside.
The bearish scenario occurs when the RSI rises above 70 (overbought level), drops below it, rises again but stays below 70, then breaks its previous swing low for momentum to the downside.
Below are examples of this strategy:
Source: Admiral Markets
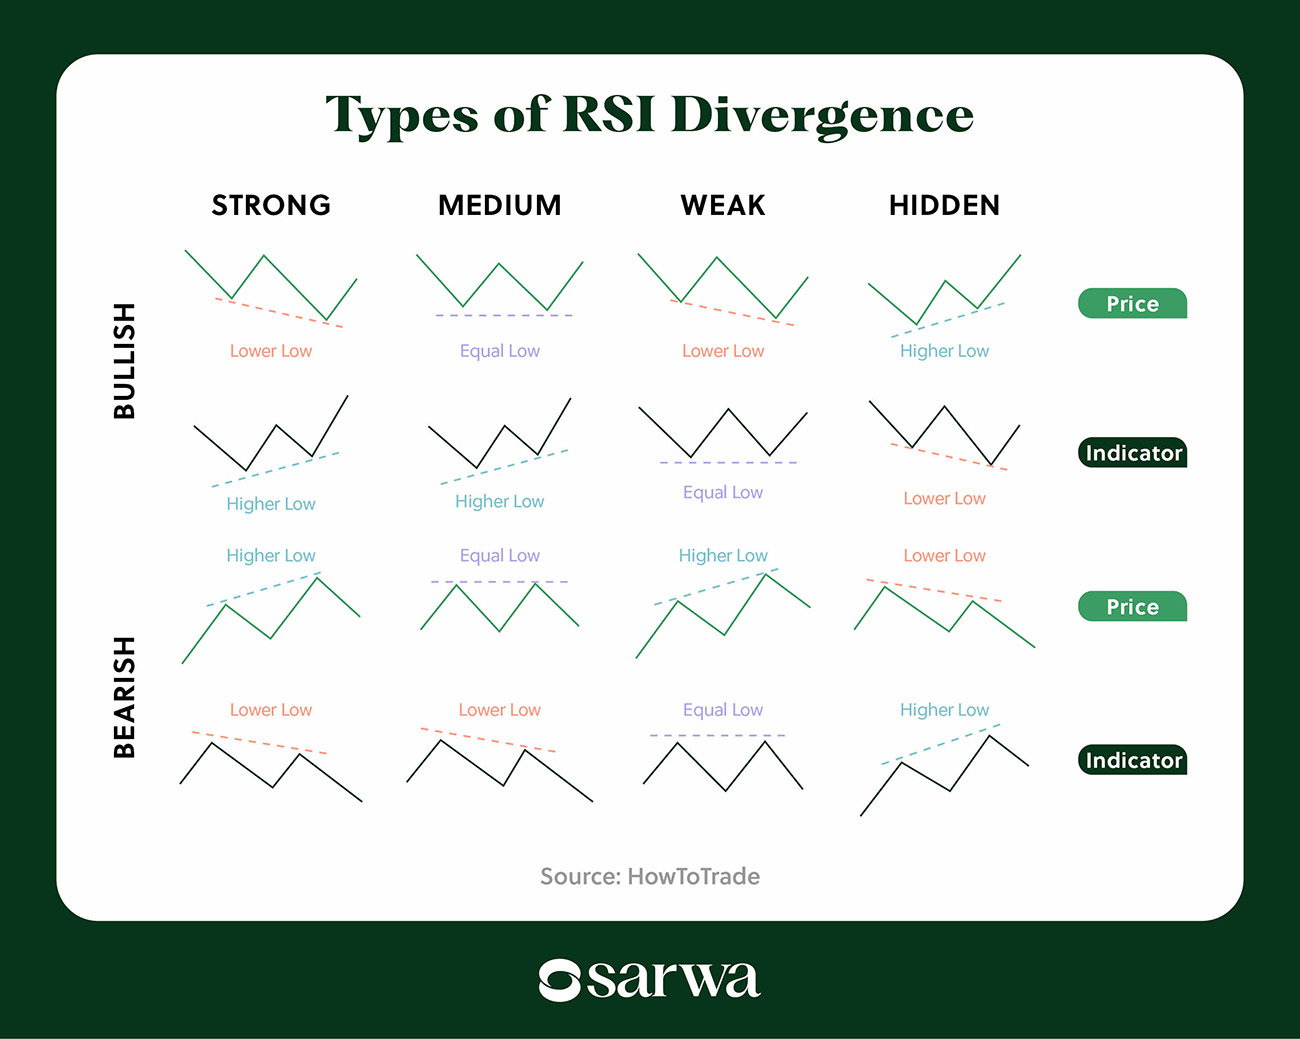
A second approach is RSI divergence.
For strong, medium, and weak divergences, price corrects in the direction of the RSI. So, if the RSI is bullish (bearish) and price is bearish (bullish), traders expect a price reversal to the upside (downside).
On the other hand, hidden divergences are price continuation patterns, as price continues its current trend, rejecting the RSI trend.
Source: HowToTrade
7. Chart pattern trading strategy
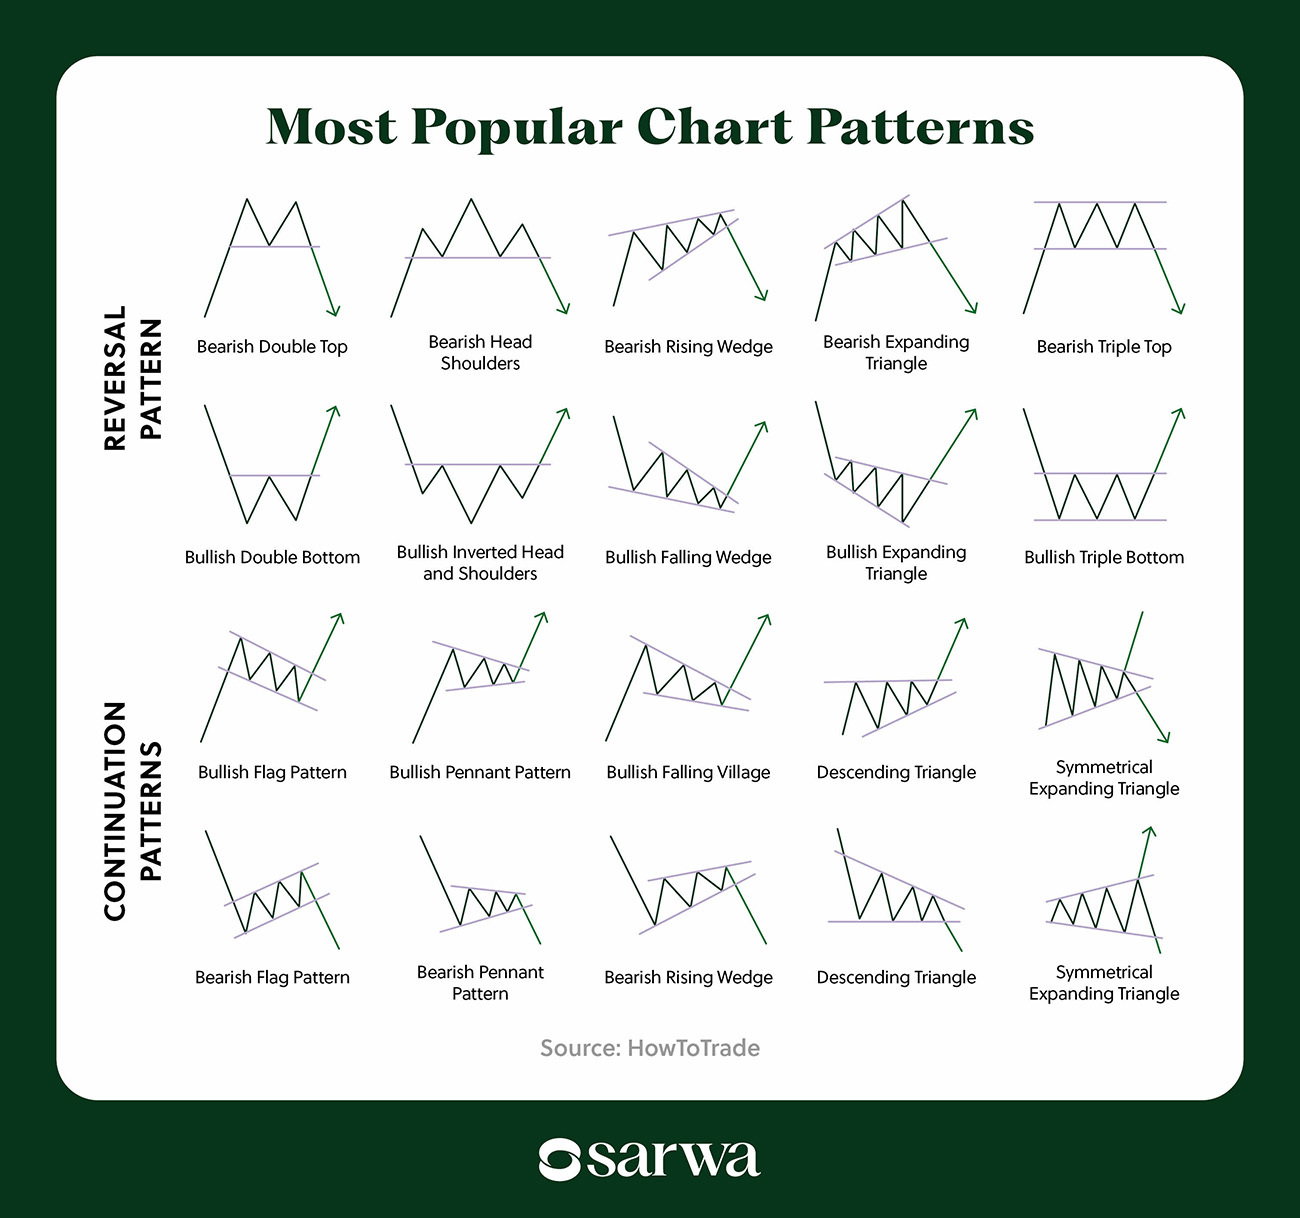
This is a broad trading strategy that includes all attempts to trade based on chart patterns.
Below are the most popular chart patterns:
Source: HowToTrade
Let’s illustrate with the Bullish Double Bottom Pattern.
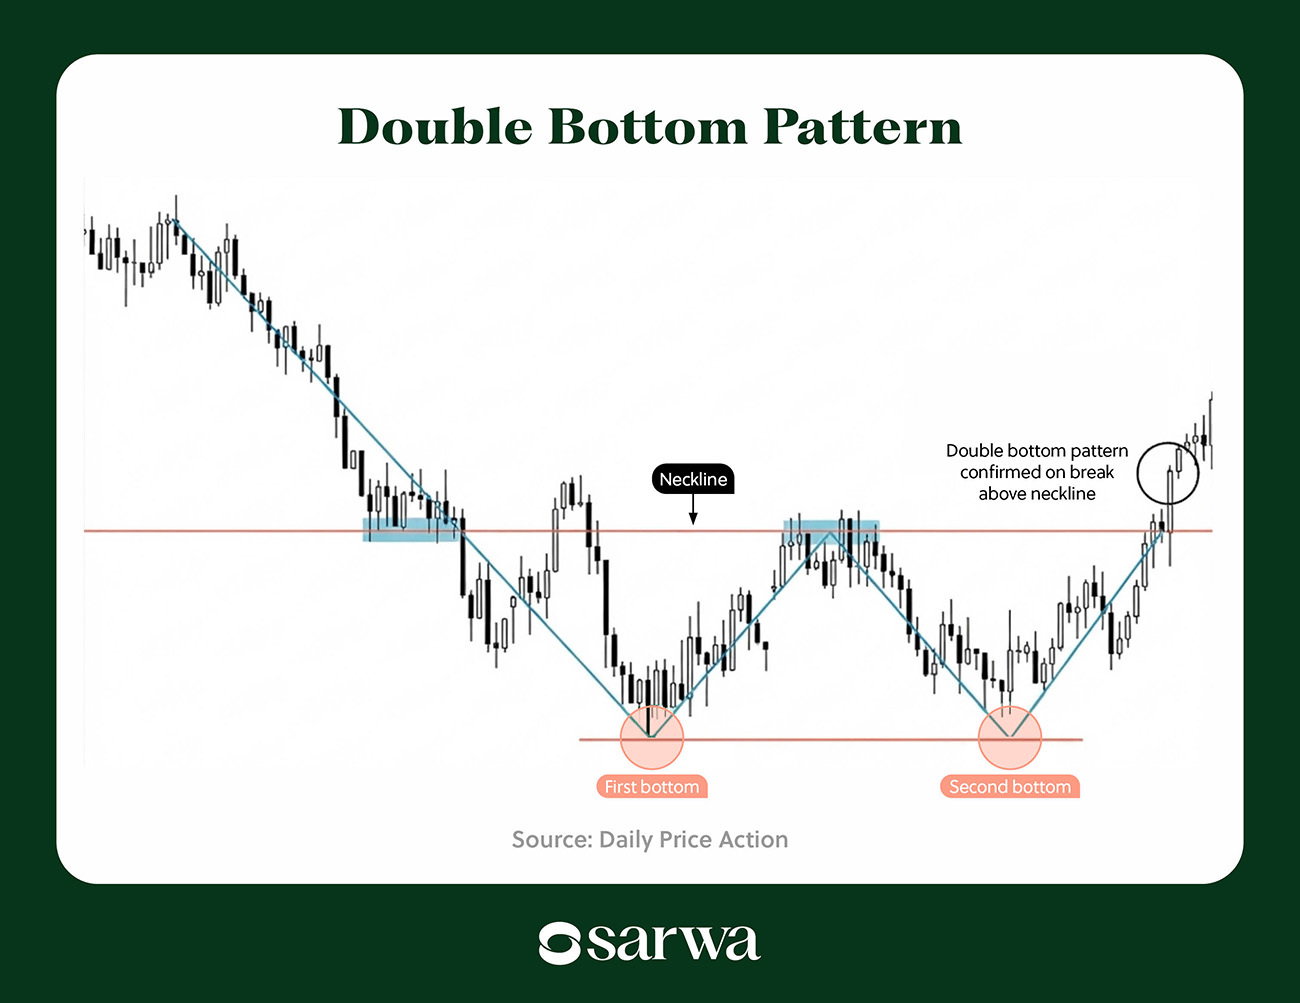
Source: Daily Price Action
Price breaking above the neckline is a signal that there is an upcoming bullish swing, especially when supported by relevant bullish candlestick patterns.
In many cases, swing traders will ride the run until price gets to a previous swing high or resistance zone that is in sight.
4. How to swing trade: Practical tips you can’t ignore
Comparing swing trading strategies with day trading strategies reveals that there are commonalities. For example, there is a trend-following strategy for both day and swing traders.
This shows that the main task of swing traders is to understand how to apply popular trading strategies in ways that match their unique goals. In other words, they must know how to conduct technical analysis in a manner appropriate to swing trading.
“What makes a trade a swing trade is the exit rule rather than the entry,” according to Gaurav Shah, a stock and options trader and managing partner at Arete Ventures, an advisory firm for institutional investors. “A lot of swing-trading failure comes from people borrowing entry signals off day traders and then holding them for a week. Same signal, different horizon, and in practice a completely different strategy.

How, then, can swing traders adapt technical analysis to their approach?
Below are some useful guidelines:
- Focus on higher timeframes: Swing traders typically analyze 4-hour and daily charts to identify trends, support and resistance levels, and potential entry points.
Unlike day traders, who may focus heavily on 5-minute or 15-minute charts, swing traders need a broader view of price movements. Higher timeframes can help filter out some of the intraday noise and reveal more meaningful market structures.
“I tend to look at the overall trend, support and resistance, momentum, and where I’d enter and exit before taking a position,” according to Deepak Shukla, the CEO of Pearl Lemon Finance, a business financing company. “Nothing particularly complicated. The timeframe is what changes things. A day trader may be looking for a move within hours, whereas a swing trader can give a position several sessions to develop.”
- Understand the broader market trend: As said above, swing trading works best when traders profit from swings within the broader trend.
Whether using trend following, moving average pullbacks, or chart patterns, swing traders often look for setups that align with the broader market direction.
For example, a trader may look for stocks trading above a rising 50-day moving average, then wait for a temporary pullback before considering an entry.
This trend trading approach can help traders avoid taking positions against strong market momentum (counter-trend strategy). As we said above, counter-trend strategies are very risky, especially when momentum is strong.
- Give trades room to develop: A swing trade may take several days or weeks to reach its target. Traders therefore need to avoid managing positions as though they were day trades.
A small intraday price decline does not necessarily invalidate a bullish swing trade. What matters is whether the original setup remains intact. This means defining stop-loss levels based on meaningful support, resistance, or other technical invalidation points rather than reacting to every small price fluctuation.
- Combine indicators with price action: Technical indicators such as RSI and moving averages can help identify potential setups, but they work best when considered alongside price action.
For example, an RSI recovery from oversold conditions may be more meaningful when it occurs near a support level during an established uptrend. The indicator provides momentum context, while the price structure helps traders assess whether the setup has a reasonable entry point.
- Account for overnight and weekend risk: Swing traders holding positions overnight are exposed to price gaps caused by earnings announcements, economic data, geopolitical events, and other developments outside regular trading hours.
Traders should therefore check upcoming events and consider how unexpected price movements could affect their positions.
However, there is a caution when it comes to paying attention to these macro factors.
“Swing traders make the most mistakes when they ignore multiple time frame markets and position themselves too aggressively into news, events, and releases,” according to Kirill Meshyk, Head of AI Data Collection at Unidata, a platform providing data for LLMs. “Traders try to find precise tops and bottoms against strong macro momentum. This leads to traders getting overly aggressive with their positions and significant drawdowns. To avoid this, traders need to institute some mandatory rules prior to trade execution. These rules should include confirmation across multiple time frames and maintaining a portfolio total risk position of 1% to 2% of capital.”

- Set realistic profit targets and holding periods: Swing traders should define what they are trying to capture before entering a trade.
A potential profit target (risk-reward ratio) may be based on a previous resistance level, a chart pattern projection, or the expected size of a price swing.
The holding period should also reflect the strategy. A trade that is expected to develop over several days may not need to be closed simply because the price has not moved after one session.
- Manage position size and risk: Swing trading involves the risk of losing money, particularly when positions are held through market-moving events.
Traders can assess the amount they are willing to risk on a trade, determine where the setup would be invalidated, and adjust their position size accordingly.
A promising chart pattern does not eliminate the possibility of a loss.
Swing traders also set stop-loss orders to cap potential losses instead of holding on to a failed trade in hope for a reversal.
It is also important to stick to the stop-loss level instead of moving it further up or down in the hope that market conditions will change.
Moreover, traders should set position sizes and stop losses that reflect the trade’s volatility rather than their convictions.
“Most people size by conviction. They put more money on the ideas they like best,” said Shah. “Size by volatility instead, so every position risks the same number of dollars. Otherwise, your favourite ideas end up being your biggest losses too. Your stop is the price that proves you wrong. Moving it doesn’t buy you time; instead, it makes being wrong more expensive.”

- Use artificial intelligence to your advantage: Using AI to trade stocks is one way to gain an advantage in the market. For swing traders, who tend to prioritize technical analysis, the automatic chart pattern recognition tools provided by TradingView and TrendSpider can help reduce the time needed to read price charts and result in more efficiency.
If you are a swing trader in the UAE, you need a trading platform that makes it easy for you to efficiently execute your strategies.
At Sarwa, you can create market and limit orders to secure precise entry and exit points. We also provide sufficient liquidity so you can execute your trades without slippage.
Transfers between your Sarwa Trade brokerage account and your local bank account are free, and you can start trading global stocks, ETFs, stock options, and cryptocurrencies with just $500.
We also support fractional trading, which makes it easy for you to diversify your trades even with low capital.
Are you ready to execute your swing trading strategies? Sign up now for Sarwa for fast, reliable, and cost-effective trading in the UAE.
Takeaways
- Swing trading offers a middle ground between day trading and long-term investing. It involves holding stocks or other assets for several days to a few weeks, aiming to capture short-to-medium-term price movements.
- Liquidity, volatility, and market trends matter when selecting stocks. Swing traders look for actively traded assets with enough price movement to create opportunities without making risk management unnecessarily difficult.
- Popular swing trading strategies include trend following, moving average pullbacks, breakouts, and RSI-based setups. Understanding how to apply these strategies to broader timeframes is central to swing trading.
- Successful swing trading requires patience, technical analysis, and risk management. Traders need to account for overnight risk, define profit targets, and manage position sizes while giving trades room to develop.
Frequently Asked Questions
1. Is swing trading suitable for beginners?
Swing trading can be a starting point for beginners who want to learn active trading without monitoring charts throughout the entire trading day. However, it still requires an understanding of technical analysis, risk management, and market volatility.
Beginners can start by learning how to identify trends, support and resistance levels, and common swing trading setups. Practising with a demo account or paper trading can also help them understand how strategies perform before risking real money.
2. What is the best timeframe for swing trading?
Swing traders commonly use daily and 4-hour charts to identify trends, support and resistance levels, and potential entry points. These timeframes provide a broader view of price movements than the 1-minute, 5-minute, or 15-minute charts often used by day traders.
The best timeframe depends on the strategy, the asset being traded, and the trader’s holding period. Some traders may also use weekly charts to understand the broader market trend.
3. Can swing traders make money in both rising and falling markets?
Yes. Swing traders can look for opportunities in both bullish and bearish markets. In an uptrend, they may buy during a pullback and aim to capture the next upward swing. In a downtrend, they may look for opportunities to sell short and profit from a downward price movement.
However, short selling involves additional risks and may not be available for every asset or trading account.
4. Can AI tools help with swing trading?
Yes. AI-powered chart pattern recognition tools, such as those provided by TradingView and TrendSpider, can help traders identify potential patterns and reduce the time spent reviewing charts.
For swing traders, these tools may be useful for screening stocks, spotting technical setups, and organizing market information. However, AI-generated signals are not guarantees of profitable trades. Traders still need to evaluate the broader trend, liquidity, volatility, and risk of each position.